QUESTION IMAGE
Question
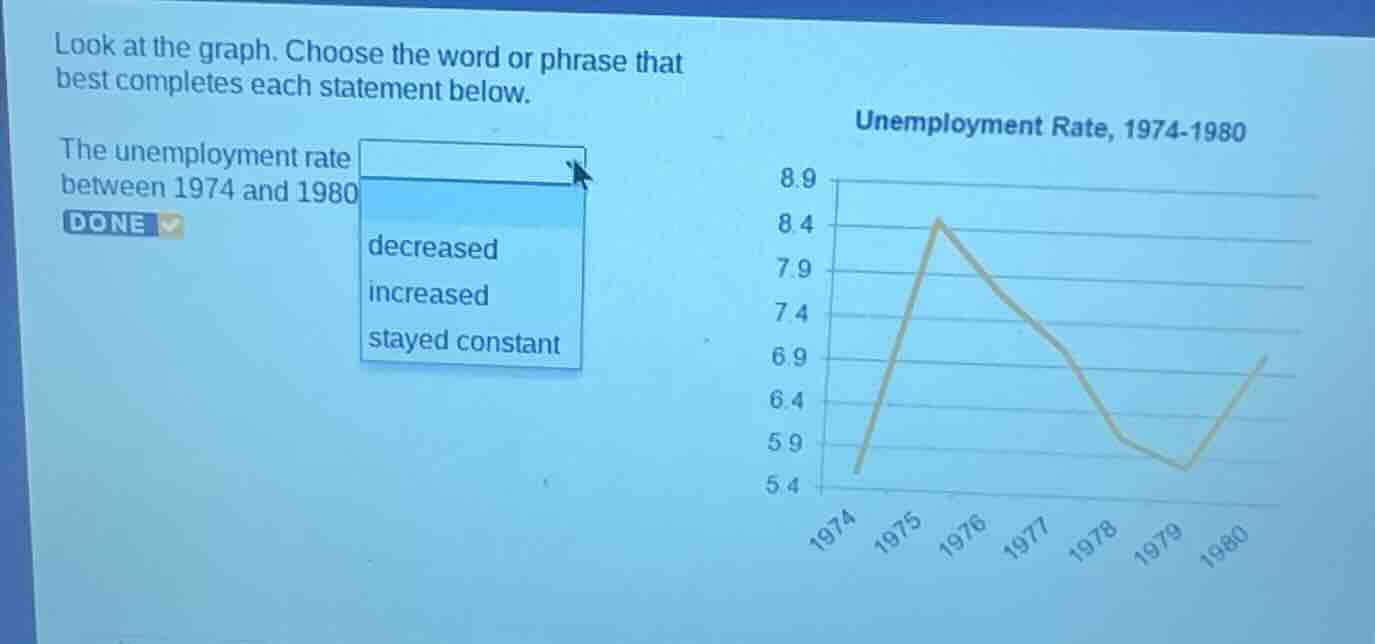
look at the graph. choose the word or phrase that best completes each statement below.
the unemployment rate between 1974 and 1980
done
options: decreased, increased, stayed constant
graph: unemployment rate, 1974 - 1980 with y - axis from 5.4 to 8.9 and x - axis years 1974 - 1980, showing a line graph of unemployment rate over those years.
Brief Explanations
First, identify the 1974 unemployment rate (~5.5) and 1980 rate (~6.9). Compare the two values: 6.9 is higher than 5.5, so the rate rose overall across the period.

Snap & solve any problem in the app
Get step-by-step solutions on Sovi AI
Photo-based solutions with guided steps
Explore more problems and detailed explanations
increased