QUESTION IMAGE
Question
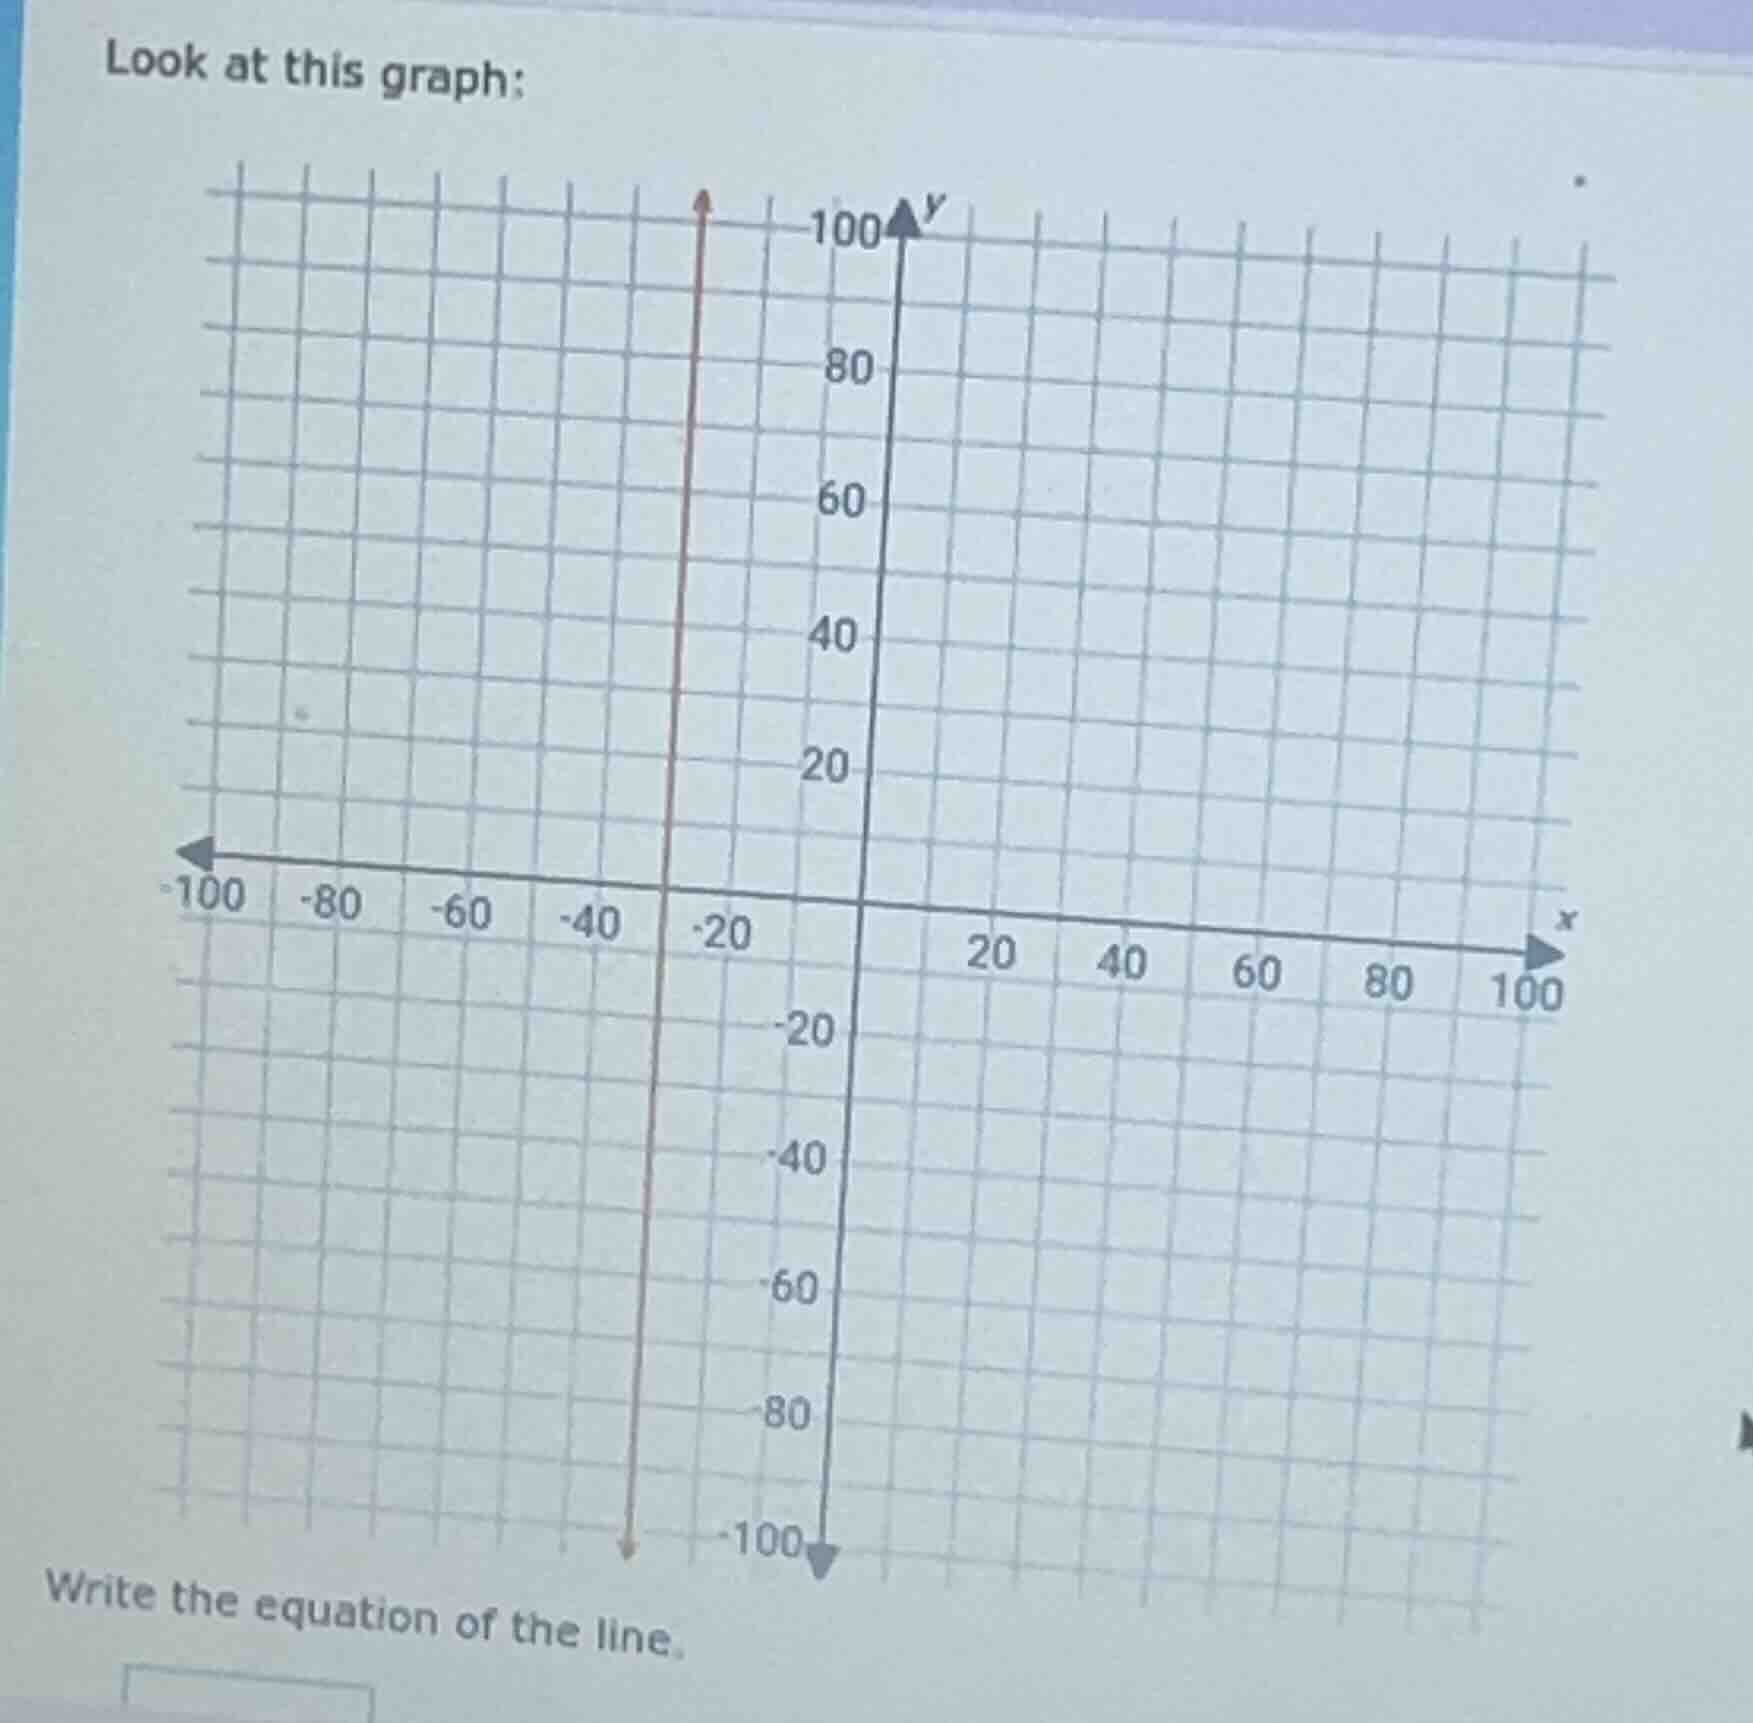
look at this graph:
write the equation of the line.
Step1: Identify the line type
The graph shows a vertical line. For a vertical line, the x - coordinate is constant for all y - values.
Step2: Determine the x - value
Looking at the graph, the vertical line passes through \(x=-30\) (since it's at the grid line corresponding to \(x = - 30\), as we can see from the x - axis labels: between - 40 and - 20, the middle is - 30? Wait, actually, looking at the graph, the vertical line is at \(x=-30\)? Wait, no, let's check the grid. The vertical line is at \(x=-30\)? Wait, the x - axis has marks at - 100, - 80, - 60, - 40, - 20, 0, 20, etc. Wait, the red vertical line is at \(x=-30\)? No, wait, looking at the graph, the vertical line is at \(x = - 30\)? Wait, no, let's count the grid squares. From \(x=-40\) to \(x=-20\) is 20 units, so each grid square is 10 units? Wait, no, the distance between - 40 and - 20 is 20, so each grid square is 10 units? Wait, no, the x - axis labels: - 100, - 80, - 60, - 40, - 20, 0, 20, 40, 60, 80, 100. So the vertical line is at \(x=-30\)? No, wait, the red line is at \(x=-30\)? Wait, no, looking at the graph, the vertical line is at \(x=-30\)? Wait, maybe I made a mistake. Wait, the vertical line is at \(x=-30\)? No, let's see: the x - coordinate of all points on a vertical line is the same. Looking at the graph, the vertical line is at \(x=-30\)? Wait, no, the grid lines: each major grid line (the ones with numbers) are 20 units apart? Wait, - 40 to - 20 is 20 units, so each minor grid line (between the major ones) is 10 units? Wait, the vertical line is at \(x=-30\)? Wait, no, the correct way: a vertical line has the equation \(x = a\), where \(a\) is the x - intercept. Looking at the graph, the vertical line passes through \(x=-30\)? Wait, no, let's check the x - axis. The vertical line is at \(x=-30\)? Wait, maybe the vertical line is at \(x=-30\)? Wait, no, the graph shows the vertical line at \(x=-30\)? Wait, actually, looking at the graph, the vertical line is at \(x=-30\)? Wait, no, let's see: the x - coordinate for the vertical line is - 30? Wait, no, the correct x - value: the vertical line is at \(x=-30\)? Wait, maybe I misread. Wait, the vertical line is at \(x=-30\)? Wait, no, the grid: from - 40 to - 20, the line is at - 30? Wait, yes. So the equation of a vertical line is \(x = a\), where \(a\) is the x - coordinate. So here, \(a=-30\)? Wait, no, wait the graph: the vertical line is at \(x=-30\)? Wait, no, let's check again. The x - axis labels: - 100, - 80, - 60, - 40, - 20, 0, 20, 40, 60, 80, 100. The vertical line is at \(x=-30\)? No, the vertical line is at \(x=-30\)? Wait, maybe the vertical line is at \(x=-30\). So the equation is \(x=-30\).
Wait, maybe I made a mistake. Wait, the vertical line is at \(x=-30\)? Wait, no, the correct x - value: looking at the graph, the vertical line is at \(x=-30\)? Wait, no, the grid lines: each major tick (with numbers) is 20 units apart. So between - 40 and - 20, the line is at - 30. So the equation of the vertical line is \(x=-30\).

Snap & solve any problem in the app
Get step-by-step solutions on Sovi AI
Photo-based solutions with guided steps
Explore more problems and detailed explanations
\(x = - 30\)