QUESTION IMAGE
Question
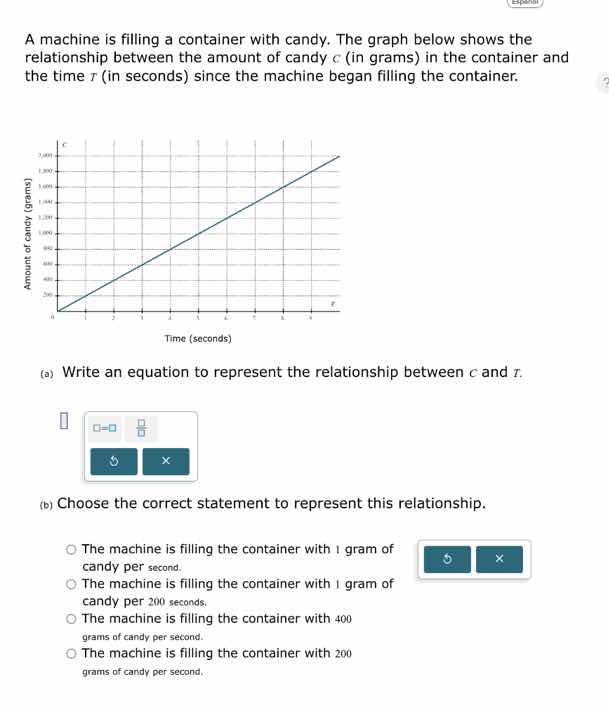
a machine is filling a container with candy. the graph below shows the relationship between the amount of candy c (in grams) in the container and the time t (in seconds) since the machine began filling the container.(a) write an equation to represent the relationship between c and t.(b) choose the correct statement to represent this relationship.the machine is filling the container with 1 gram of candy per second.the machine is filling the container with 1 gram of candy per 200 seconds.the machine is filling the container with 400 grams of candy per second.the machine is filling the container with 200 grams of candy per second.
Step1: Identify slope (fill rate)
From the graph, when $t=10$, $c=2000$. Slope $m=\frac{2000}{10}=200$.
Step2: Write linear equation
The relationship is proportional ($c=0$ when $t=0$), so $c=mt$. Substitute $m=200$:
$c=200t$
Step3: Match to correct statement
The slope 200 means 200 grams per second.

Snap & solve any problem in the app
Get step-by-step solutions on Sovi AI
Photo-based solutions with guided steps
Explore more problems and detailed explanations
(a) $c=200t$
(b) The machine is filling the container with 200 grams of candy per second.