QUESTION IMAGE
Question
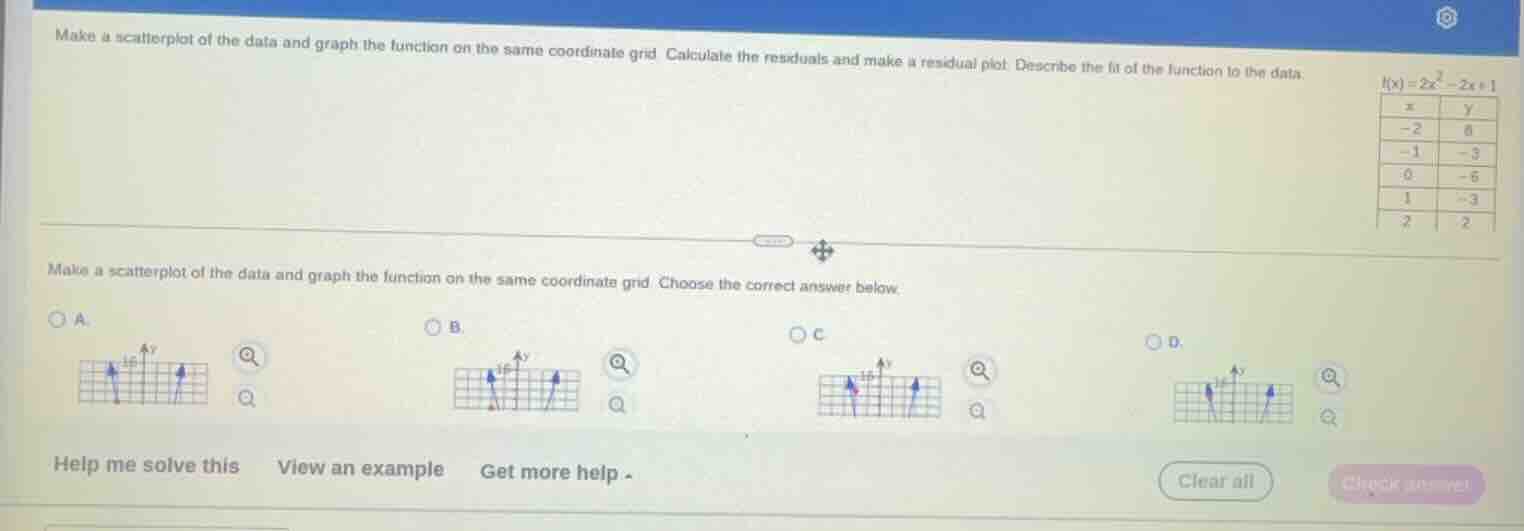
make a scatterplot of the data and graph the function on the same coordinate grid. calculate the residuals and make a residual plot. describe the fit of the function to the data.
$f(x) = 2x^2 - 2x + 1$
| $x$ | $y$ |
|---|---|
| $-1$ | $-3$ |
| $0$ | $-6$ |
| $1$ | $-3$ |
| $2$ | $2$ |
make a scatterplot of the data and graph the function on the same coordinate grid. choose the correct answer below.
a.
graph a
b.
graph b
c.
graph c
d.
graph d
Step1: Plot data points
Points: $(-2,6), (-1,-3), (0,-6), (1,-3), (2,2)$
Step2: Graph the quadratic function
Function: $f(x)=2x^2-2x-6$
Step3: Match to correct option
Verify that option A shows both the plotted data points and the correct parabola shape of $f(x)=2x^2-2x-6$ on the same grid.

Snap & solve any problem in the app
Get step-by-step solutions on Sovi AI
Photo-based solutions with guided steps
Explore more problems and detailed explanations
A