QUESTION IMAGE
Question
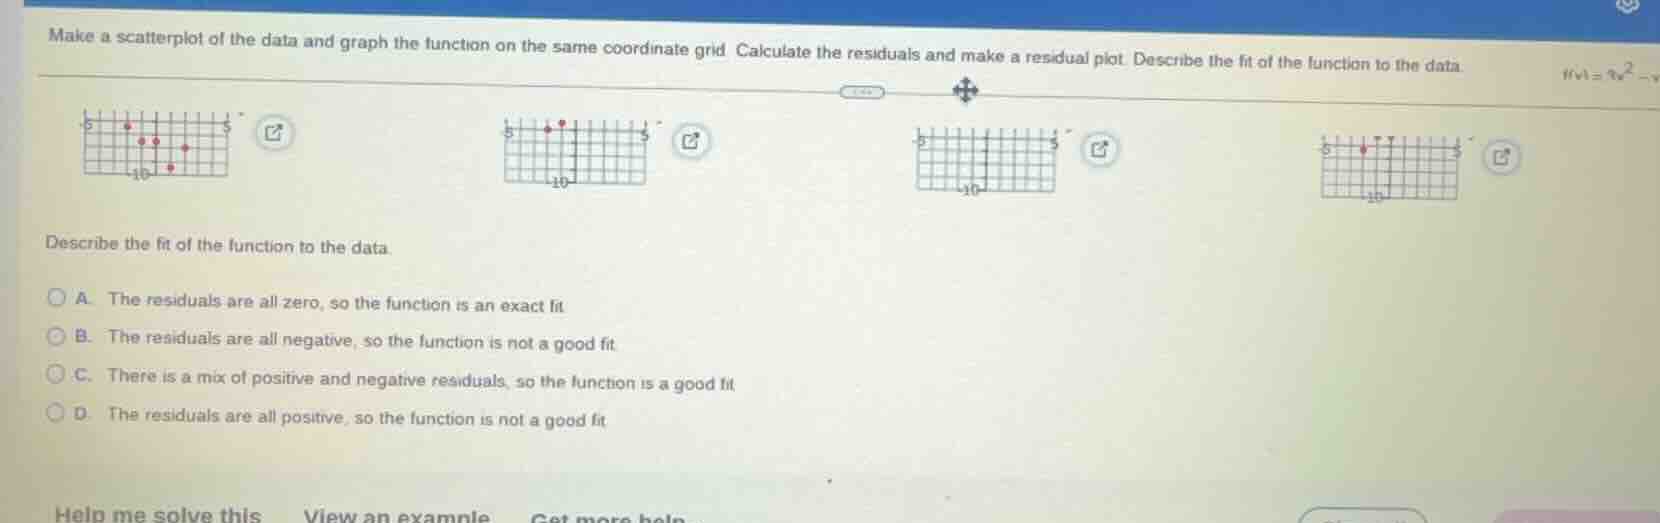
make a scatterplot of the data and graph the function on the same coordinate grid. calculate the residuals and make a residual plot. describe the fit of the function to the data.
describe the fit of the function to the data.
a. the residuals are all zero, so the function is an exact fit
b. the residuals are all negative, so the function is not a good fit
c. there is a mix of positive and negative residuals, so the function is a good fit
d. the residuals are all positive, so the function is not a good fit
A well-fitting function will have residuals (differences between observed and predicted values) that are randomly mixed positive and negative, with no clear pattern. This indicates the function captures the underlying trend of the data without consistent over- or under-prediction. Options A (all zero residuals is extremely rare for real data), B (all negative residuals means consistent under-prediction), and D (all positive residuals means consistent over-prediction) describe poor or non-realistic fits, while option C matches the characteristics of a good function fit.

Snap & solve any problem in the app
Get step-by-step solutions on Sovi AI
Photo-based solutions with guided steps
Explore more problems and detailed explanations
C. There is a mix of positive and negative residuals, so the function is a good fit