QUESTION IMAGE
Question
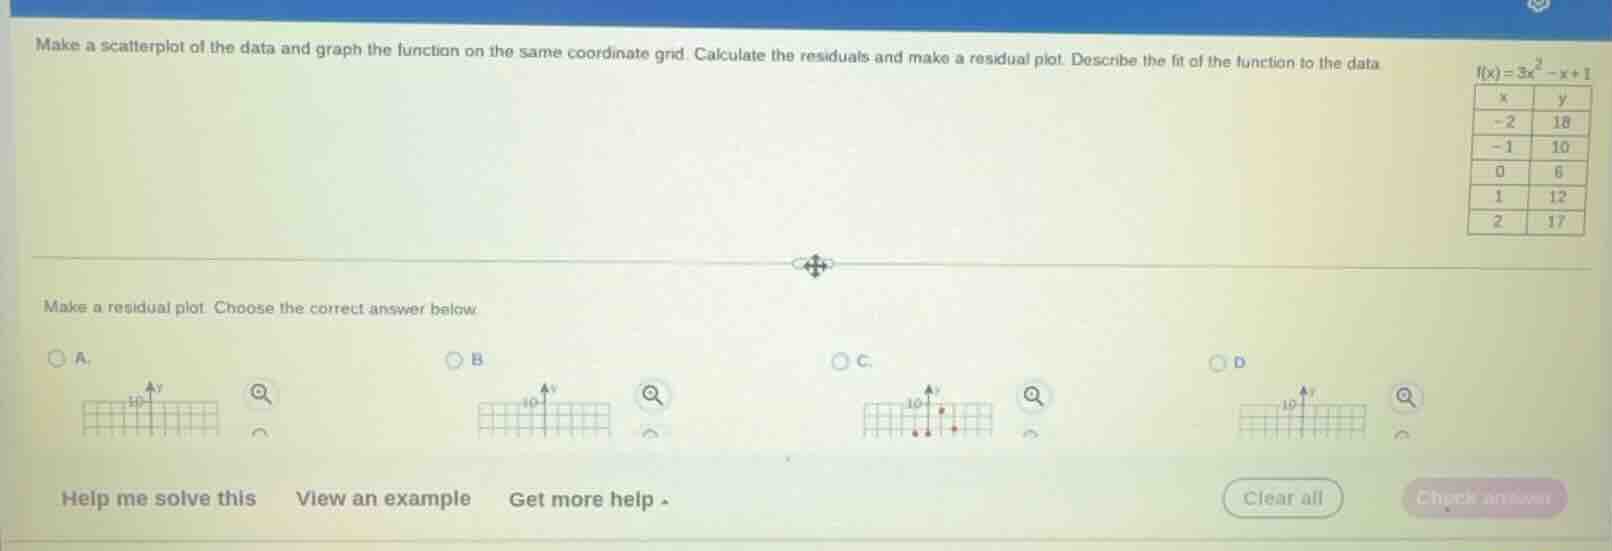
make a scatterplot of the data and graph the function on the same coordinate grid. calculate the residuals and make a residual plot. describe the fit of the function to the data.
$f(x)=3x^2 - x + 1$
| x | y |
|---|---|
| -1 | 10 |
| 0 | 6 |
| 1 | 12 |
| 2 | 17 |
make a residual plot. choose the correct answer below.
a.
image of a coordinate grid
b.
image of a coordinate grid
c.
image of a coordinate grid
d.
image of a coordinate grid
Step1: Calculate predicted y-values
For each $x$, compute $\hat{y}=3x^2 - x + 1$:
- $x=-2$: $\hat{y}=3(-2)^2 - (-2) + 1=12+2+1=15$
- $x=-1$: $\hat{y}=3(-1)^2 - (-1) + 1=3+1+1=5$
- $x=0$: $\hat{y}=3(0)^2 - 0 + 1=1$
- $x=1$: $\hat{y}=3(1)^2 - 1 + 1=3-1+1=3$
- $x=2$: $\hat{y}=3(2)^2 - 2 + 1=12-2+1=11$
Step2: Calculate residuals ($y-\hat{y}$)
Residual = observed $y$ - predicted $\hat{y}$:
- $x=-2$: $18-15=3$
- $x=-1$: $10-5=5$
- $x=0$: $6-1=5$
- $x=1$: $12-3=9$
- $x=2$: $17-11=6$
Step3: Match to residual plot
Residual points are $(-2,3), (-1,5), (0,5), (1,9), (2,6)$, which matches option C.

Snap & solve any problem in the app
Get step-by-step solutions on Sovi AI
Photo-based solutions with guided steps
Explore more problems and detailed explanations
C