QUESTION IMAGE
Question
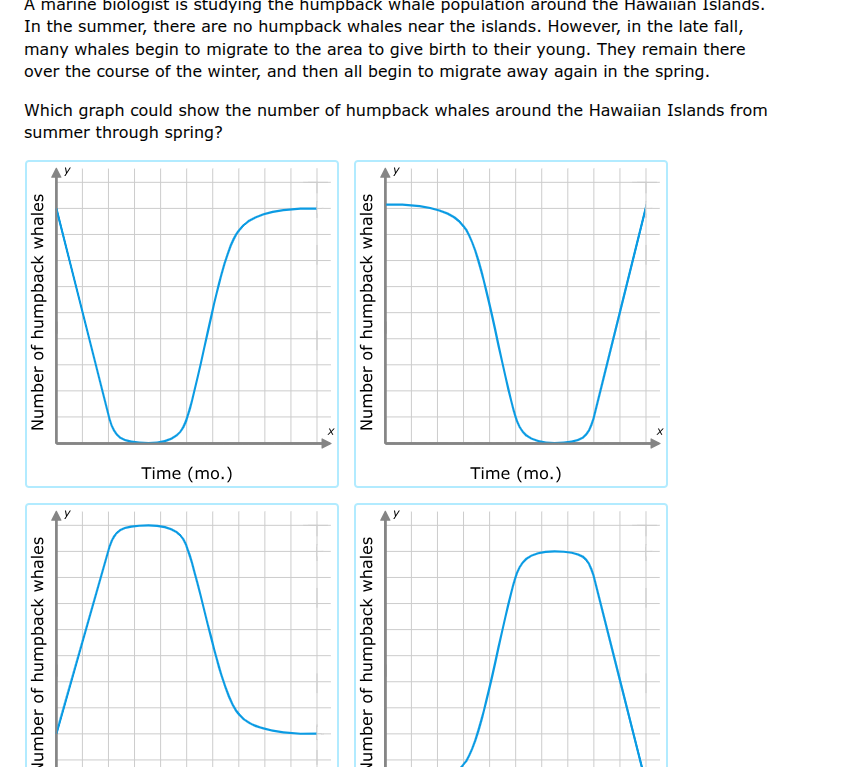
a marine biologist is studying the humpback whale population around the hawaiian islands. in the summer, there are no humpback whales near the islands. however, in the late fall, many whales begin to migrate to the area to give birth to their young. they remain there over the course of the winter, and then all begin to migrate away again in the spring. which graph could show the number of humpback whales around the hawaiian islands from summer through spring?
Step1: Map summer whale count
Summer count = 0, so start at $y \approx 0$.
Step2: Map late fall migration
Late fall: whales arrive, $y$ increases.
Step3: Map winter population
Winter: whales stay, $y$ remains high.
Step4: Map spring migration
Spring: whales leave, $y$ drops back to 0.
Step5: Match to graph
Only the top-left graph starts at 0, rises to a steady high, then stays (matches summer→fall→winter→spring pattern).

Snap & solve any problem in the app
Get step-by-step solutions on Sovi AI
Photo-based solutions with guided steps
Explore more problems and detailed explanations
The top-left graph (first graph, starting at a high y-value, dropping to near zero, then rising to a steady high value)