QUESTION IMAGE
Question
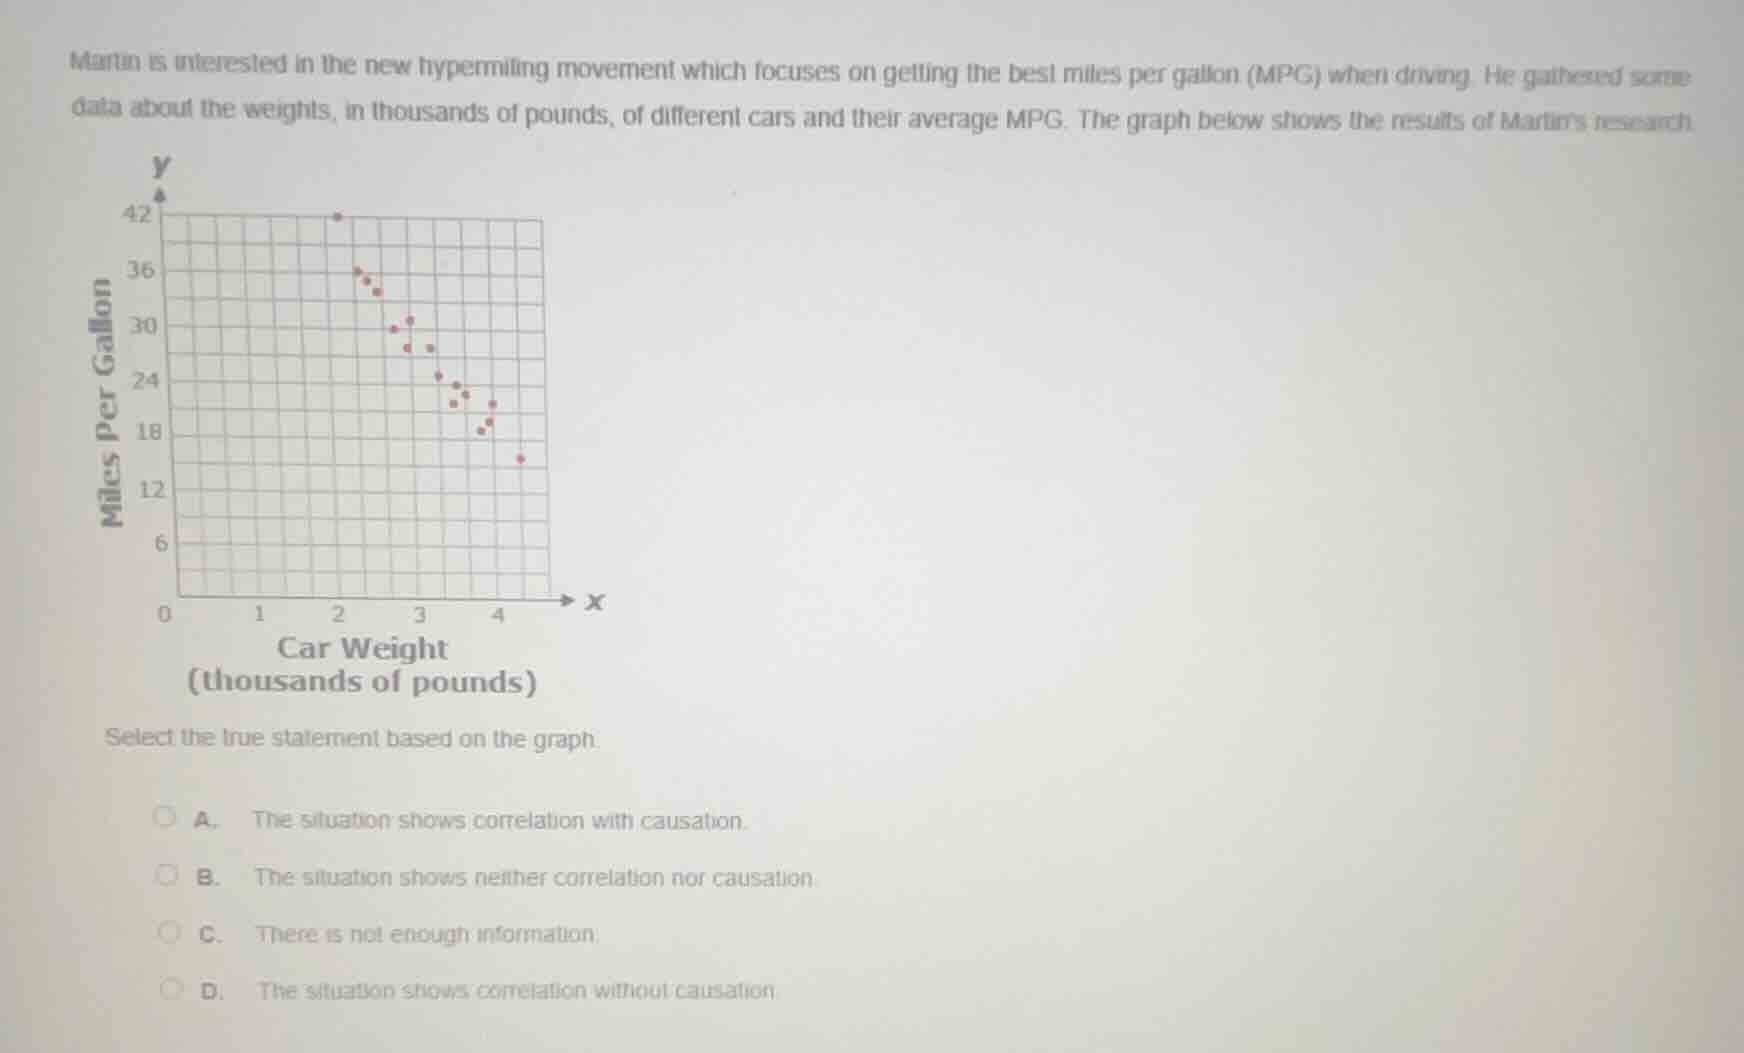
martin is interested in the new hypermiling movement which focuses on getting the best miles per gallon (mpg) when driving. he gathered some data about the weights, in thousands of pounds, of different cars and their average mpg. the graph below shows the results of martins research.select the true statement based on the graph.a. the situation shows correlation with causation.b. the situation shows neither correlation nor causation.c. there is not enough information.d. the situation shows correlation without causation
The scatter plot shows a clear downward trend: as car weight (x-axis) increases, miles per gallon (y-axis) decreases, indicating a negative correlation. Additionally, heavier cars require more fuel to move, so the increased weight directly causes lower MPG, meaning there is causation alongside the correlation.

Snap & solve any problem in the app
Get step-by-step solutions on Sovi AI
Photo-based solutions with guided steps
Explore more problems and detailed explanations
A. The situation shows correlation with causation.