QUESTION IMAGE
Question
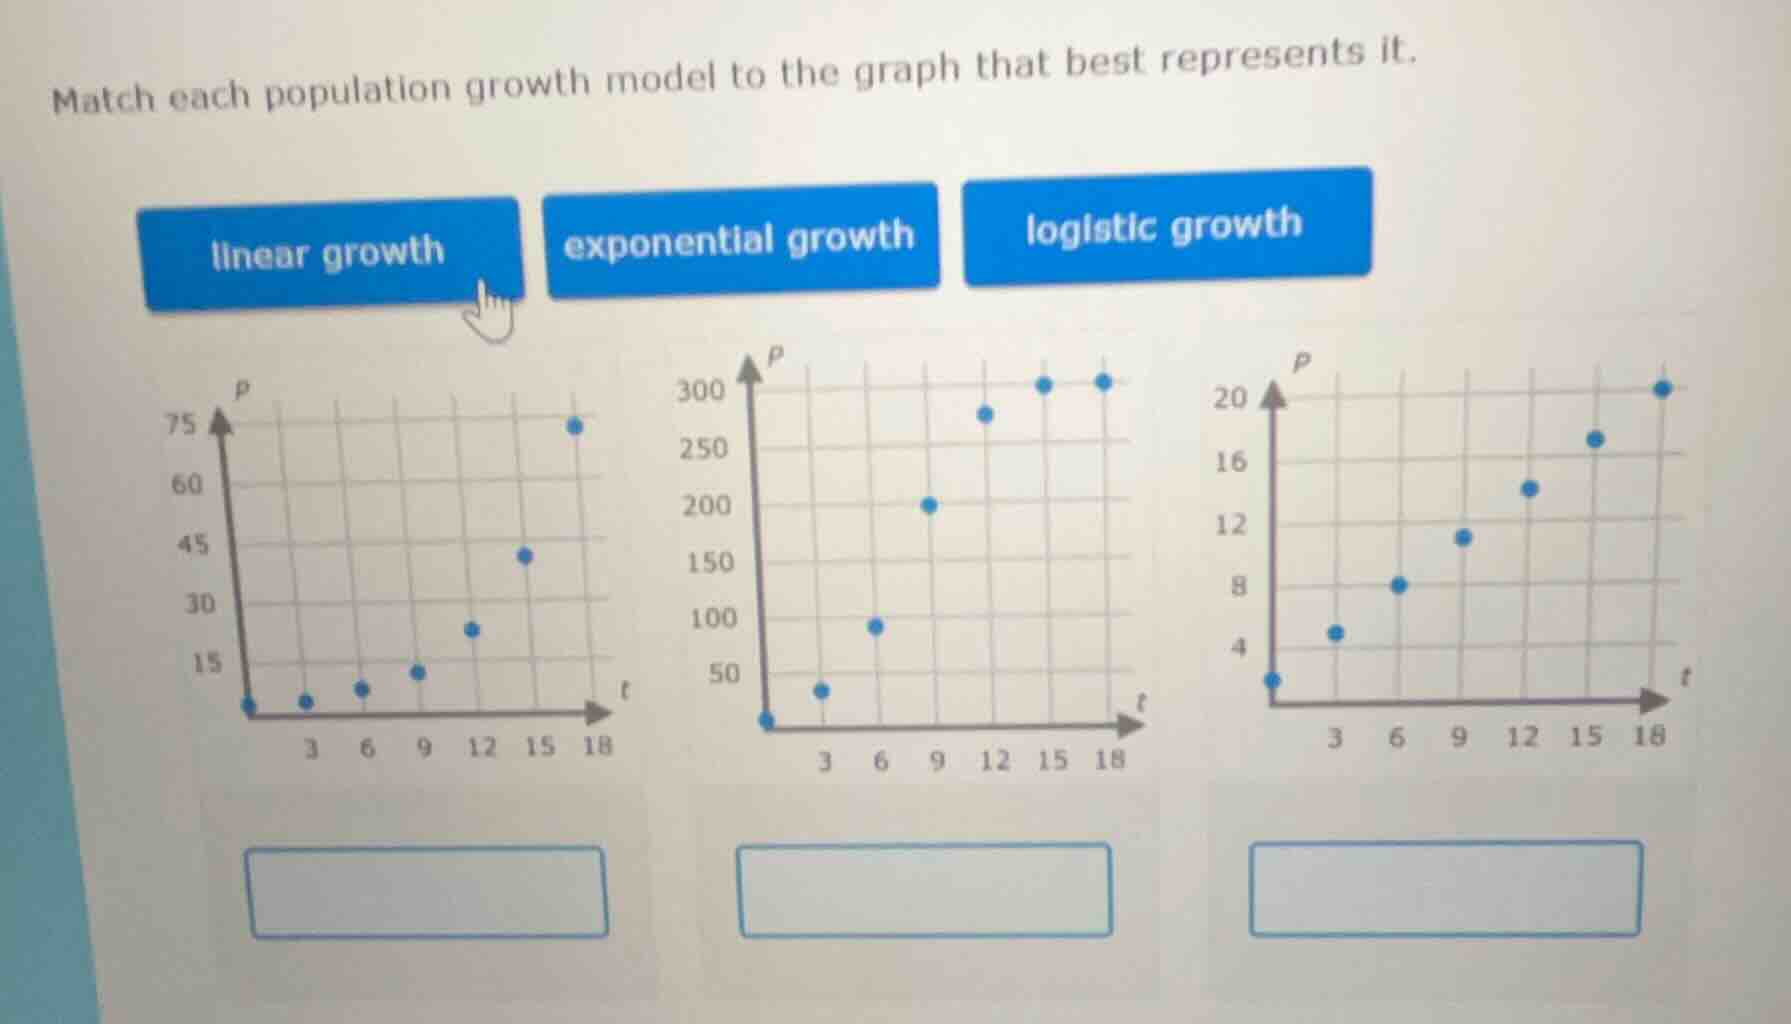
match each population growth model to the graph that best represents it.
linear growth exponential growth logistic growth
Brief Explanations
- First graph (left): Calculate the difference between consecutive population values:
- From t=0 to t=3: $10-5=5$
- t=3 to t=6: $15-10=5$
- t=6 to t=9: $20-15=5$
- t=9 to t=12: $25-20=5$
- t=12 to t=15: $40-25=15$
- t=15 to t=18: $70-40=30$
The growth rate increases over time, which is characteristic of exponential growth.
- Second graph (middle): Calculate the difference between consecutive population values:
- t=0 to t=3: $30-0=30$
- t=3 to t=6: $90-30=60$
- t=6 to t=9: $200-90=110$
- t=9 to t=12: $280-200=80$
- t=12 to t=15: $300-280=20$
- t=15 to t=18: $300-300=0$
Growth starts slow, accelerates, then slows until it reaches a carrying capacity, which is logistic growth.
- Third graph (right): Calculate the difference between consecutive population values:
- t=0 to t=3: $5-2=3$
- t=3 to t=6: $8-5=3$
- t=6 to t=9: $11-8=3$
- t=9 to t=12: $14-11=3$
- t=12 to t=15: $17-14=3$
- t=15 to t=18: $20-17=3$
The population increases by a constant amount each interval, which is linear growth.

Snap & solve any problem in the app
Get step-by-step solutions on Sovi AI
Photo-based solutions with guided steps
Explore more problems and detailed explanations
- Left graph: exponential growth
- Middle graph: logistic growth
- Right graph: linear growth