QUESTION IMAGE
Question
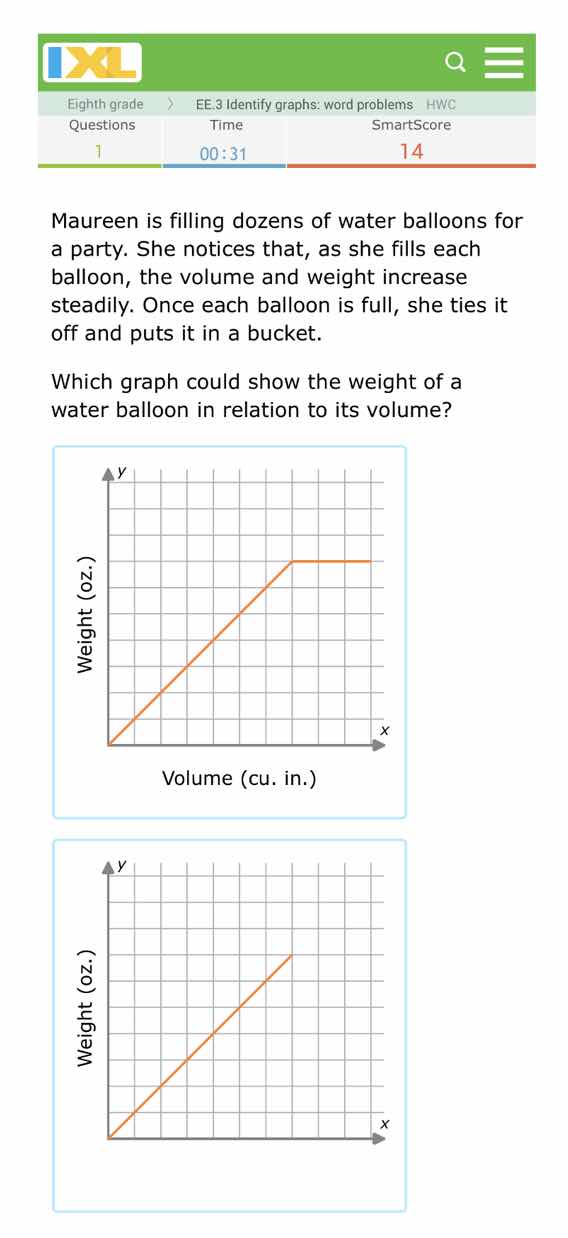
maureen is filling dozens of water balloons for a party. she notices that, as she fills each balloon, the volume and weight increase steadily. once each balloon is full, she ties it off and puts it in a bucket. which graph could show the weight of a water balloon in relation to its volume?
Step1: Analyze the relationship
As the volume of water in the balloon increases, the weight should increase steadily (since more water means more weight) until the balloon is full. After that, the volume stops increasing (because she ties it off), so the weight should also stop increasing (become constant).
Step2: Compare the graphs
- The first graph has a line that increases (showing weight increasing with volume) and then becomes horizontal (showing weight constant when volume stops increasing, as the balloon is full).
- The second graph has a line that keeps increasing, which would imply the volume is still increasing after the balloon is full, which doesn't match the scenario.

Snap & solve any problem in the app
Get step-by-step solutions on Sovi AI
Photo-based solutions with guided steps
Explore more problems and detailed explanations
The first graph (the one with the increasing line followed by a horizontal line)