QUESTION IMAGE
Question
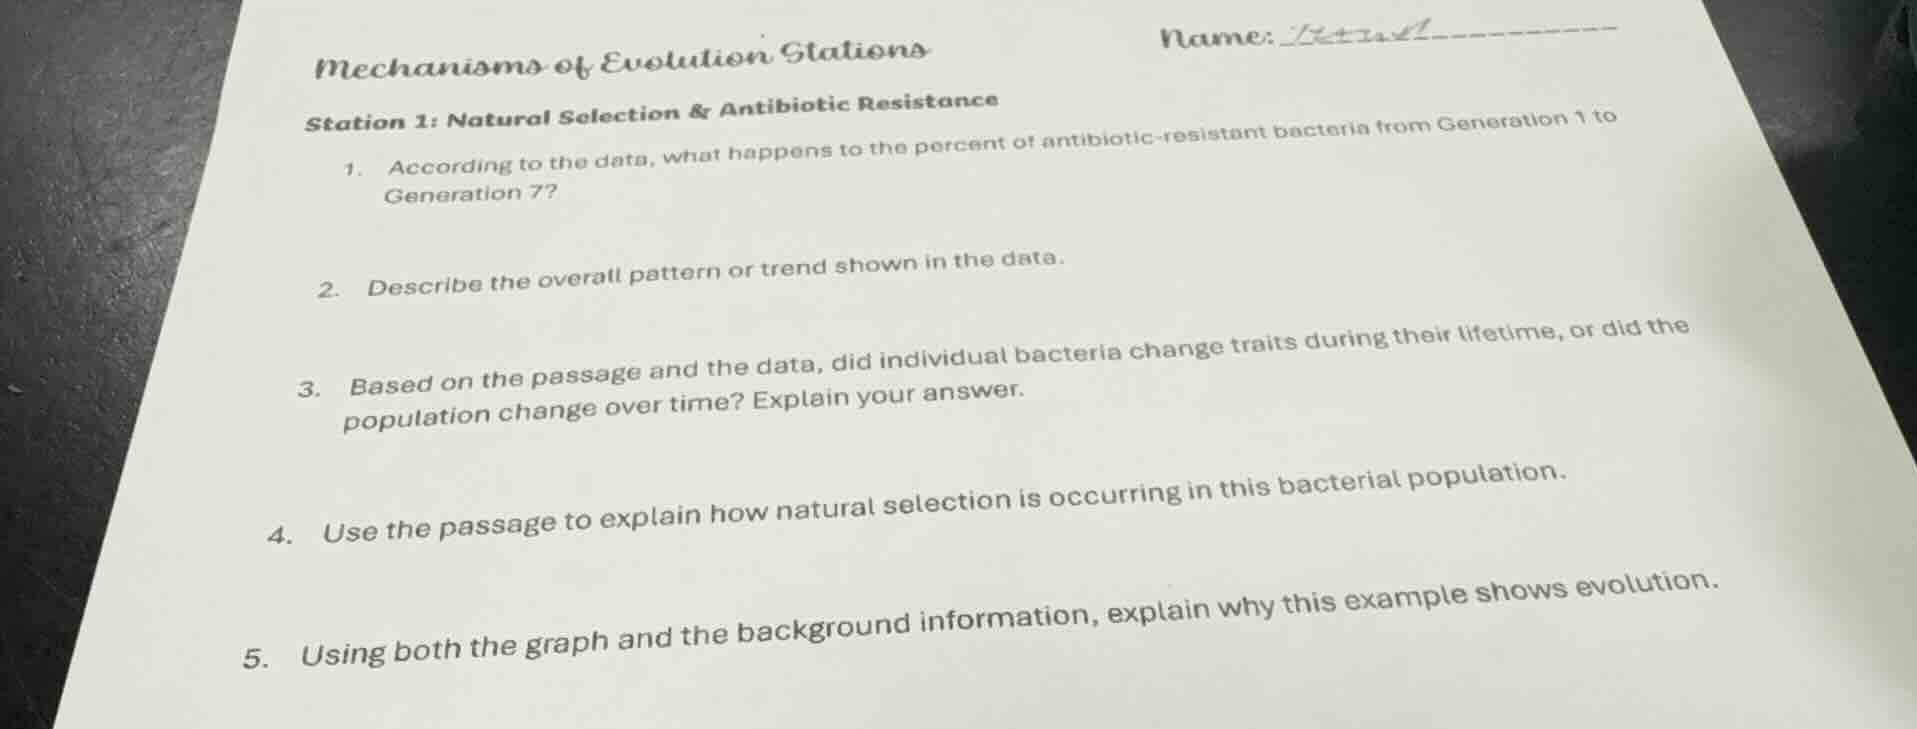
mechanisms of evolution stations
name:
station 1: natural selection & antibiotic resistance
- according to the data, what happens to the percent of antibiotic - resistant bacteria from generation 1 to generation 7?
- describe the overall pattern or trend shown in the data.
- based on the passage and the data, did individual bacteria change traits during their lifetime, or did the population change over time? explain your answer.
- use the passage to explain how natural selection is occurring in this bacterial population.
- using both the graph and the background information, explain why this example shows evolution.
Since the data (graph or numerical values) for the antibiotic - resistant bacteria across generations is not provided, we can't answer these questions directly. However, we can give general guidance on how to approach them:
For Question 1:
To answer what happens to the percent of antibiotic - resistant bacteria from Generation 1 to Generation 7, you would:
- Locate the percentage of antibiotic - resistant bacteria in Generation 1 and Generation 7 from the given data (either a table, graph, or text - based data).
- Compare these two values. If the percentage in Generation 7 is higher than in Generation 1, we can say it increased; if lower, it decreased; and if approximately the same, it stayed relatively constant.
For Question 2:
To describe the overall pattern or trend:
- Look at the data for all the generations (not just 1 and 7).
- Check if the percentage of antibiotic - resistant bacteria is increasing over time (e.g., each subsequent generation has a higher percentage than the previous), decreasing, fluctuating (going up and down), or staying stable. For example, if the percentage goes from 10% in Generation 1, 15% in Generation 2, 20% in Generation 3, etc., the trend is an increase over time.
For Question 3:
- Individual bacteria do not change their traits (like becoming antibiotic - resistant) during their lifetime in the context of natural selection for antibiotic resistance in most cases. Bacteria have a set of genes, and if they are not resistant initially, they will not develop resistance during their single lifetime (except in cases of horizontal gene transfer, but the question seems to be about the basic natural selection model).
- The population changes over time. This is because in a bacterial population, there is genetic variation (some bacteria are naturally resistant due to mutations or other genetic factors). When exposed to antibiotics, the non - resistant bacteria are killed, and the resistant bacteria survive and reproduce. So, over generations, the proportion of resistant bacteria in the population increases as the resistant ones pass on their resistance - related genes to their offspring.
For Question 4:
To explain how natural selection is occurring in this bacterial population:
- Variation: There is variation in the bacterial population with respect to antibiotic resistance. Some bacteria have genes that make them resistant to the antibiotic, and some do not.
- Selection Pressure: The presence of the antibiotic is the selection pressure. The antibiotic kills the non - resistant bacteria.
- Survival and Reproduction: The antibiotic - resistant bacteria survive because they are not killed by the antibiotic. These surviving bacteria then reproduce, passing on their resistance - conferring genes to their offspring. Over time, the proportion of resistant bacteria in the population increases because more and more of the bacteria in each new generation are descendants of the resistant bacteria from previous generations.
For Question 5:
To explain why this example shows evolution:
- Evolution is defined as a change in the genetic composition of a population over time.
- From the graph (and background information), we can see that the proportion of antibiotic - resistant bacteria in the population is changing over the generations. As the percentage of antibiotic - resistant bacteria changes, the genetic makeup of the bacterial population (in terms of the frequency of resistance - related genes) is also changing. This change in the genetic composition of the population over…

Snap & solve any problem in the app
Get step-by-step solutions on Sovi AI
Photo-based solutions with guided steps
Explore more problems and detailed explanations
Since the data (graph or numerical values) for the antibiotic - resistant bacteria across generations is not provided, we can't answer these questions directly. However, we can give general guidance on how to approach them:
For Question 1:
To answer what happens to the percent of antibiotic - resistant bacteria from Generation 1 to Generation 7, you would:
- Locate the percentage of antibiotic - resistant bacteria in Generation 1 and Generation 7 from the given data (either a table, graph, or text - based data).
- Compare these two values. If the percentage in Generation 7 is higher than in Generation 1, we can say it increased; if lower, it decreased; and if approximately the same, it stayed relatively constant.
For Question 2:
To describe the overall pattern or trend:
- Look at the data for all the generations (not just 1 and 7).
- Check if the percentage of antibiotic - resistant bacteria is increasing over time (e.g., each subsequent generation has a higher percentage than the previous), decreasing, fluctuating (going up and down), or staying stable. For example, if the percentage goes from 10% in Generation 1, 15% in Generation 2, 20% in Generation 3, etc., the trend is an increase over time.
For Question 3:
- Individual bacteria do not change their traits (like becoming antibiotic - resistant) during their lifetime in the context of natural selection for antibiotic resistance in most cases. Bacteria have a set of genes, and if they are not resistant initially, they will not develop resistance during their single lifetime (except in cases of horizontal gene transfer, but the question seems to be about the basic natural selection model).
- The population changes over time. This is because in a bacterial population, there is genetic variation (some bacteria are naturally resistant due to mutations or other genetic factors). When exposed to antibiotics, the non - resistant bacteria are killed, and the resistant bacteria survive and reproduce. So, over generations, the proportion of resistant bacteria in the population increases as the resistant ones pass on their resistance - related genes to their offspring.
For Question 4:
To explain how natural selection is occurring in this bacterial population:
- Variation: There is variation in the bacterial population with respect to antibiotic resistance. Some bacteria have genes that make them resistant to the antibiotic, and some do not.
- Selection Pressure: The presence of the antibiotic is the selection pressure. The antibiotic kills the non - resistant bacteria.
- Survival and Reproduction: The antibiotic - resistant bacteria survive because they are not killed by the antibiotic. These surviving bacteria then reproduce, passing on their resistance - conferring genes to their offspring. Over time, the proportion of resistant bacteria in the population increases because more and more of the bacteria in each new generation are descendants of the resistant bacteria from previous generations.
For Question 5:
To explain why this example shows evolution:
- Evolution is defined as a change in the genetic composition of a population over time.
- From the graph (and background information), we can see that the proportion of antibiotic - resistant bacteria in the population is changing over the generations. As the percentage of antibiotic - resistant bacteria changes, the genetic makeup of the bacterial population (in terms of the frequency of resistance - related genes) is also changing. This change in the genetic composition of the population over time (from Generation 1 to later generations) is what constitutes evolution.
If you can provide the specific data (such as the percentages of antibiotic - resistant bacteria for each generation or a description of the graph), we can give more precise answers to these questions.