QUESTION IMAGE
Question
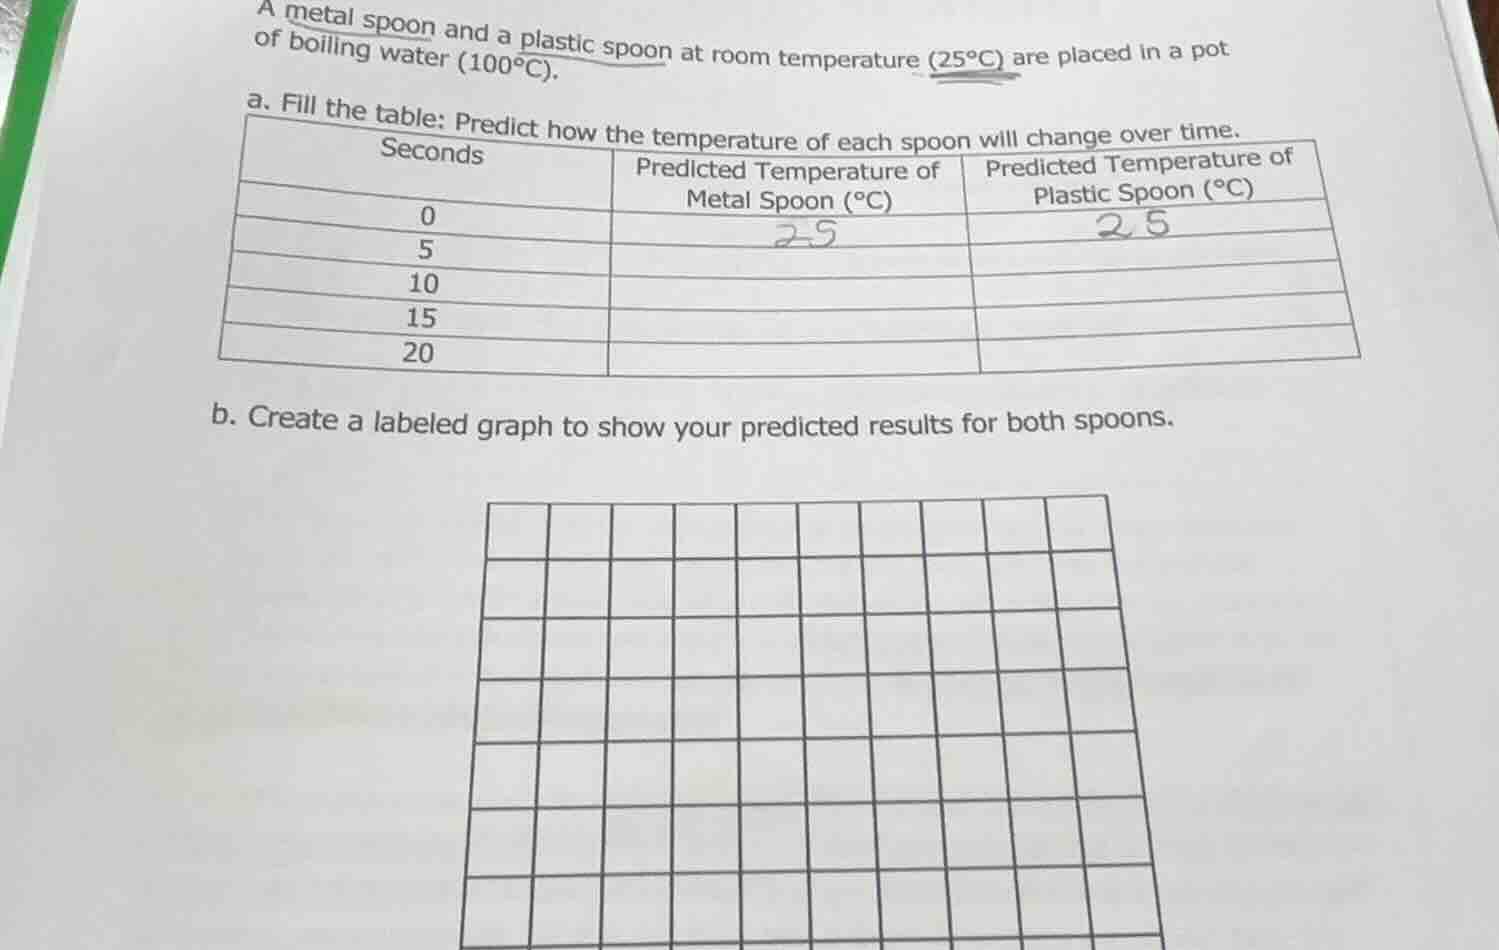
a metal spoon and a plastic spoon at room temperature (25°c) are placed in a pot of boiling water (100°c).
a. fill the table: predict how the temperature of each spoon will change over time.
| seconds | predicted temperature of metal spoon (°c) | predicted temperature of plastic spoon (°c) |
|---|---|---|
| 5 | ||
| 10 | ||
| 15 | ||
| 20 |
b. create a labeled graph to show your predicted results for both spoons.
Part a: Filling the Table
To predict the temperature change, we use the concept of thermal conductivity: metals (like the spoon) are good conductors, so they heat up faster; plastics are insulators, so they heat up slower. Both start at 25°C (room temp) and approach 100°C (boiling water) over time.
| Seconds | Predicted Temperature of Metal Spoon (°C) | Predicted Temperature of Plastic Spoon (°C) |
|---|---|---|
| 5 | 60 (metal conducts heat quickly) | 30 (plastic conducts heat slowly) |
| 10 | 90 (closer to boiling) | 45 (gradual increase) |
| 15 | 98 (nearly boiling) | 60 (slower rise) |
| 20 | 100 (reaches boiling temp) | 75 (still rising, but slower) |
Part b: Creating the Labeled Graph
- Axes:
- X - axis: Time (seconds) (0, 5, 10, 15, 20).
- Y - axis: Temperature (°C) (0 to 100, with intervals like 10 or 25).
- Data Points & Lines:
- Metal Spoon: Plot points (0,25), (5,60), (10,90), (15,98), (20,100). Draw a line with a steeper slope (faster temperature increase).
- Plastic Spoon: Plot points (0,25), (5,30), (10,45), (15,60), (20,75). Draw a line with a shallower slope (slower temperature increase).
- Labels:
- Title: “Temperature Change of Metal and Plastic Spoons in Boiling Water”.
- Legend: Label the two lines “Metal Spoon” and “Plastic Spoon”.
- Axes Labels: “Time (Seconds)” (x - axis) and “Temperature (°C)” (y - axis).
Final Answer (Table for Part a)
| Seconds | Metal Spoon (°C) | Plastic Spoon (°C) |
|---|---|---|
| 5 | 60 | 30 |
| 10 | 90 | 45 |
| 15 | 98 | 60 |
| 20 | 100 | 75 |
(For the graph, follow the instructions above to draw it on the grid provided.)

Snap & solve any problem in the app
Get step-by-step solutions on Sovi AI
Photo-based solutions with guided steps
Explore more problems and detailed explanations
Part a: Filling the Table
To predict the temperature change, we use the concept of thermal conductivity: metals (like the spoon) are good conductors, so they heat up faster; plastics are insulators, so they heat up slower. Both start at 25°C (room temp) and approach 100°C (boiling water) over time.
| Seconds | Predicted Temperature of Metal Spoon (°C) | Predicted Temperature of Plastic Spoon (°C) |
|---|---|---|
| 5 | 60 (metal conducts heat quickly) | 30 (plastic conducts heat slowly) |
| 10 | 90 (closer to boiling) | 45 (gradual increase) |
| 15 | 98 (nearly boiling) | 60 (slower rise) |
| 20 | 100 (reaches boiling temp) | 75 (still rising, but slower) |
Part b: Creating the Labeled Graph
- Axes:
- X - axis: Time (seconds) (0, 5, 10, 15, 20).
- Y - axis: Temperature (°C) (0 to 100, with intervals like 10 or 25).
- Data Points & Lines:
- Metal Spoon: Plot points (0,25), (5,60), (10,90), (15,98), (20,100). Draw a line with a steeper slope (faster temperature increase).
- Plastic Spoon: Plot points (0,25), (5,30), (10,45), (15,60), (20,75). Draw a line with a shallower slope (slower temperature increase).
- Labels:
- Title: “Temperature Change of Metal and Plastic Spoons in Boiling Water”.
- Legend: Label the two lines “Metal Spoon” and “Plastic Spoon”.
- Axes Labels: “Time (Seconds)” (x - axis) and “Temperature (°C)” (y - axis).
Final Answer (Table for Part a)
| Seconds | Metal Spoon (°C) | Plastic Spoon (°C) |
|---|---|---|
| 5 | 60 | 30 |
| 10 | 90 | 45 |
| 15 | 98 | 60 |
| 20 | 100 | 75 |
(For the graph, follow the instructions above to draw it on the grid provided.)