QUESTION IMAGE
Question
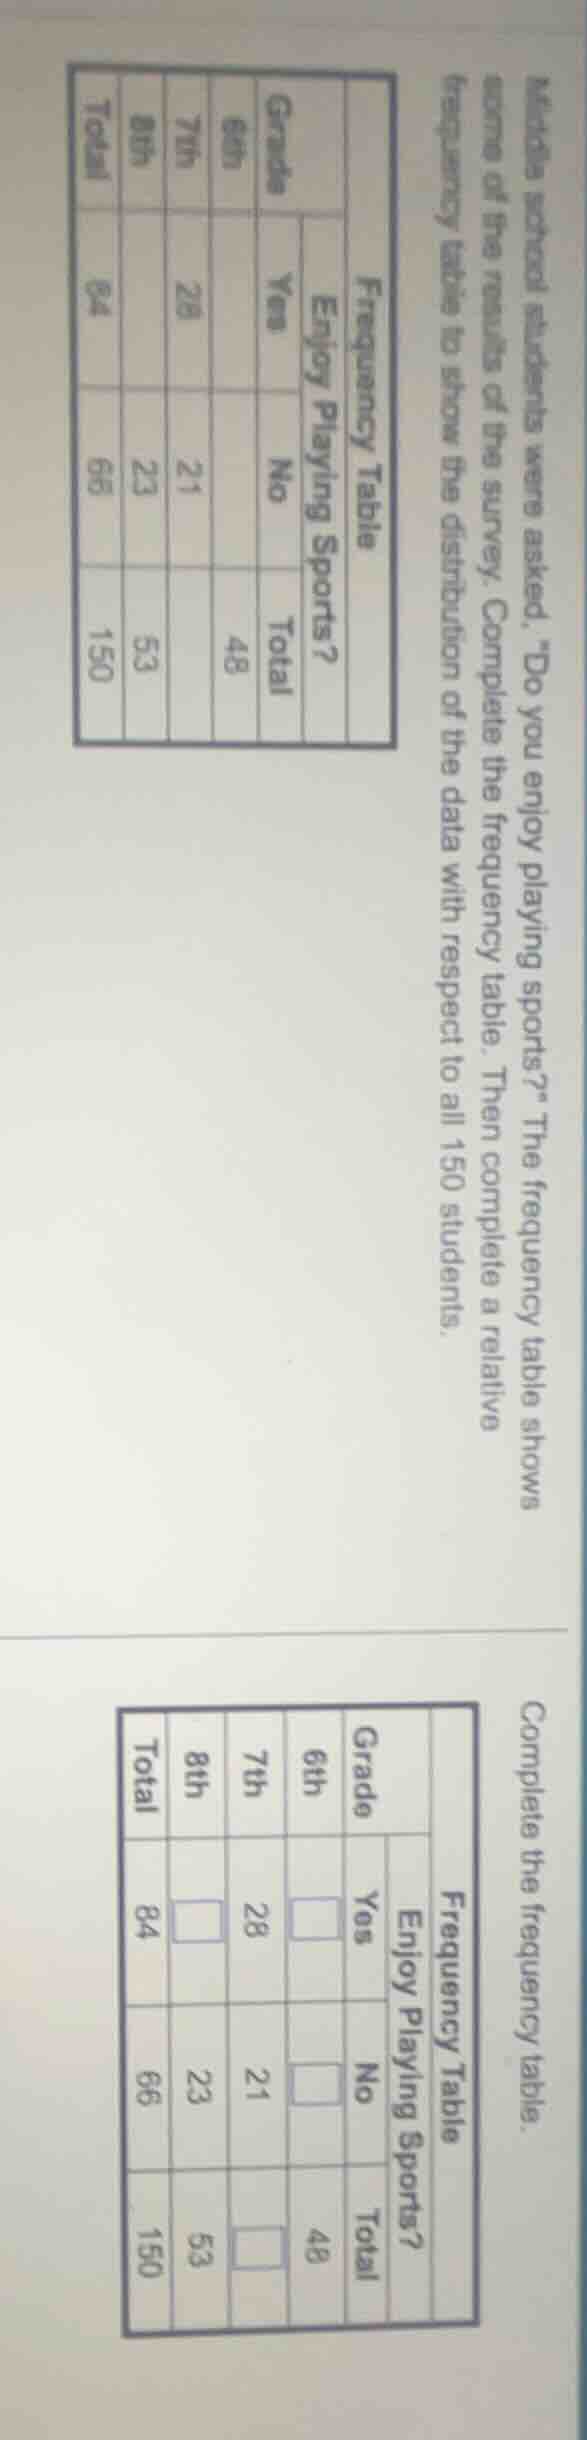
middle school students were asked, \do you enjoy playing sports?\ the frequency table shows some of the results of the survey. complete the frequency table. then complete a relative frequency table to show the distribution of the data with respect to all 150 students.
frequency table
enjoy playing sports?
\t\tgrade
\t\t6th\t7th\t8th\ttotal
yes\t\t\t28\t\t84
no\t\t\t21\t23\t66
total\t48\t\t53\t150
complete the frequency table.
frequency table
enjoy playing sports?
\t\tgrade
\t\t6th\t7th\t8th\ttotal
yes\t□\t28\t□\t84
no\t□\t21\t23\t66
total\t48\t□\t53\t150
Step1: Find 6th grade "Yes"
Total 6th grade is 48, "No" for 6th grade: total - "Yes" = 48 - "Yes"? Wait, no, total = "Yes" + "No". So "Yes" for 6th grade: total (48) - "No" (let's find "No" first? Wait, total "No" is 66. 7th "No" is 21, 8th "No" is 23, so 6th "No" = 66 - 21 -23 = 22. Then 6th "Yes" = 48 - 22 = 26.
Step2: Find 8th grade "Yes"
Total "Yes" is 84. 6th "Yes" is 26, 7th "Yes" is 28, so 8th "Yes" = 84 -26 -28 = 30.
Step3: Find 7th grade total
7th "Yes" is 28, "No" is 21, so total 7th = 28 +21 = 49.

Snap & solve any problem in the app
Get step-by-step solutions on Sovi AI
Photo-based solutions with guided steps
Explore more problems and detailed explanations
6th grade "Yes": 26
6th grade "No": 22
8th grade "Yes": 30
7th grade total: 49
Filled table:
| Grade | Enjoy Playing Sports? | ||
|---|---|---|---|
| 6th | 26 | 22 | 48 |
| 7th | 28 | 21 | 49 |
| 8th | 30 | 23 | 53 |
| Total | 84 | 66 | 150 |