QUESTION IMAGE
Question
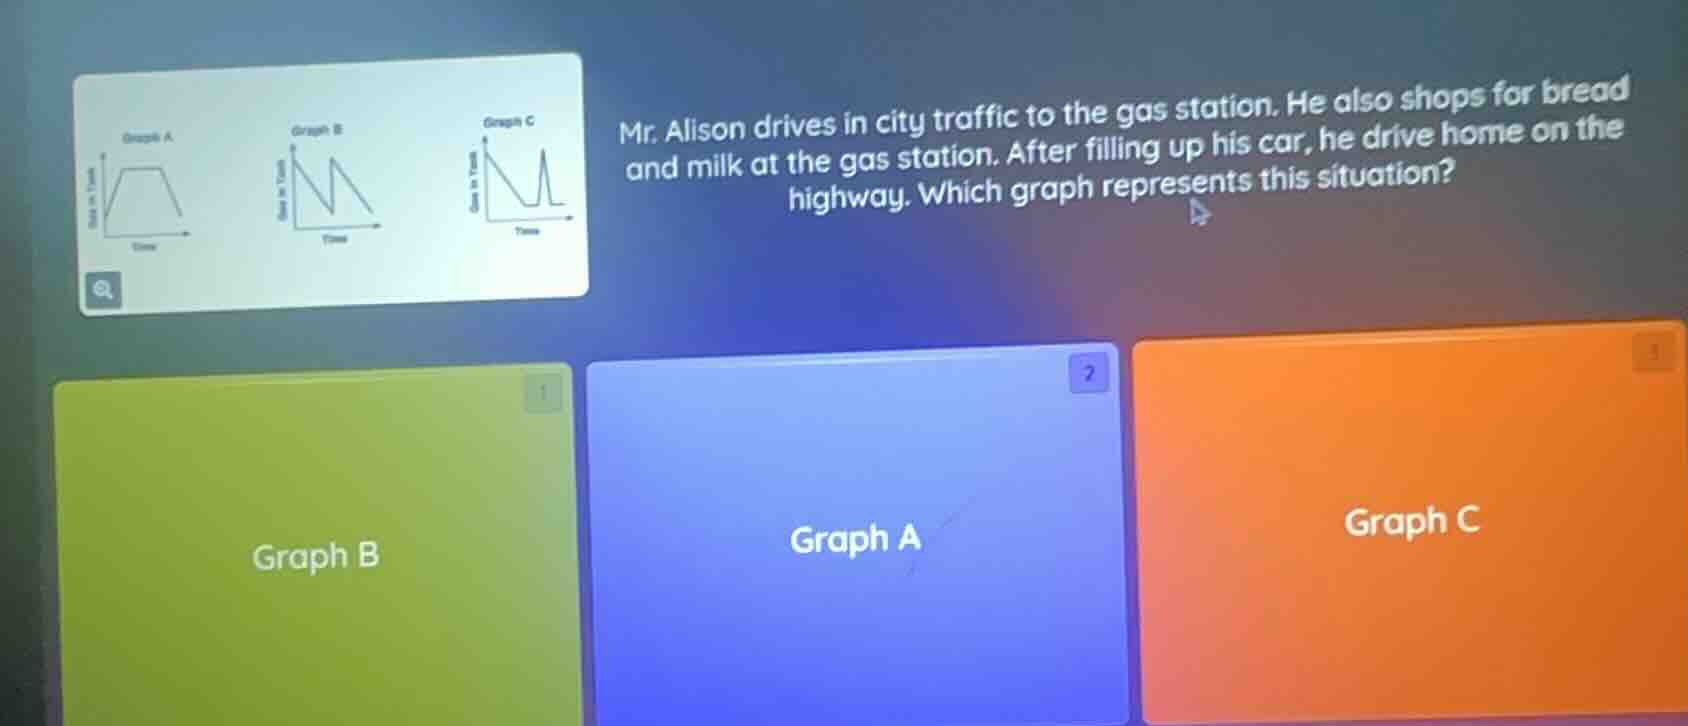
mr. alison drives in city traffic to the gas station. he also shops for bread and milk at the gas station. after filling up his car, he drive home on the highway. which graph represents this situation?
options: graph b, graph a, graph c
Step1: Analyze driving to gas station
City traffic means speed increases then maybe constant or variable, but when shopping (stopped), speed is 0. Then driving home on highway (higher speed, so steeper decrease in time - distance? Wait, the graph is probably distance vs time or speed vs time. Let's think: when driving to gas station (city traffic: speed up, then stop for shopping (speed 0), then drive home (highway, faster speed, so time to cover distance is less, so the graph should have a part where speed is 0 (shopping), then a steeper slope (faster) on the way back. Wait, looking at the graphs: Graph C has a peak (maybe shopping? No, wait, let's re - evaluate. Wait, the problem is about which graph represents the situation. Let's break down the events:
- Drive to gas station: starts from home (distance 0), moves towards gas station (distance increases, speed in city traffic: maybe a slope, then stop for shopping (distance constant, speed 0), then fill up (distance still constant), then drive home (distance decreases, faster speed (steeper slope) because highway.
Wait, Graph C: Let's see the shape. The first part: distance increases (driving to gas station), then a dip (maybe shopping? No, wait, maybe speed vs time. Wait, maybe it's speed vs time. So:
- Start: speed 0 (home), then speed up (driving to gas station in city traffic), then stop (shopping, speed 0), then fill up (speed 0), then drive home on highway (higher speed, so speed increases to a higher level, then decreases as he reaches home). Wait, Graph C has a peak at the end, which could be the highway driving (higher speed) before stopping at home. Wait, maybe I got it wrong. Wait, the correct graph should have: driving to gas station (speed increases, then constant or variable), then stop (speed 0) for shopping, then fill up (speed 0), then drive home (higher speed, so speed is higher than city traffic, then decreases to 0 at home). So looking at the graphs: Graph C has a part where speed goes up, then down (shopping), then up again (highway) and then down. Wait, maybe the correct graph is Graph C? Wait, no, wait the options are Graph B, Graph A, Graph C. Wait, let's check again. Wait, the user's options at the bottom are Graph B (green), Graph A (blue), Graph C (orange). Wait, the correct answer is Graph C? Wait, no, let's think again. Wait, when driving to the gas station (city traffic), then shopping (speed 0), then driving home (highway, faster speed). So the graph of speed vs time: starts at 0, increases (driving to gas station), then 0 (shopping), then increases to a higher speed (highway) then decreases to 0 (home). So Graph C has a peak at the end, which is the highway driving (higher speed) before stopping. So the correct graph is Graph C? Wait, no, maybe I made a mistake. Wait, the initial analysis: the key is that after shopping, driving home on the highway is faster, so the time to return home is less, so the slope of the distance - time graph (if it's distance vs time) would be steeper on the way back. But maybe the graph is speed vs time. So:
- Drive to gas station: speed increases (city traffic, maybe a slope), then speed 0 (shopping), then speed 0 (filling up), then speed increases to a higher level (highway) then decreases to 0 (home). So Graph C has a speed that goes up, down (shopping), up (highway) and down. So that matches. So the correct graph is Graph C.
Step2: Confirm with the options
The options at the bottom: the orange box is Graph C. So the answer should be Graph C.

Snap & solve any problem in the app
Get step-by-step solutions on Sovi AI
Photo-based solutions with guided steps
Explore more problems and detailed explanations
Graph C (the orange - colored option with the label "Graph C")