QUESTION IMAGE
Question
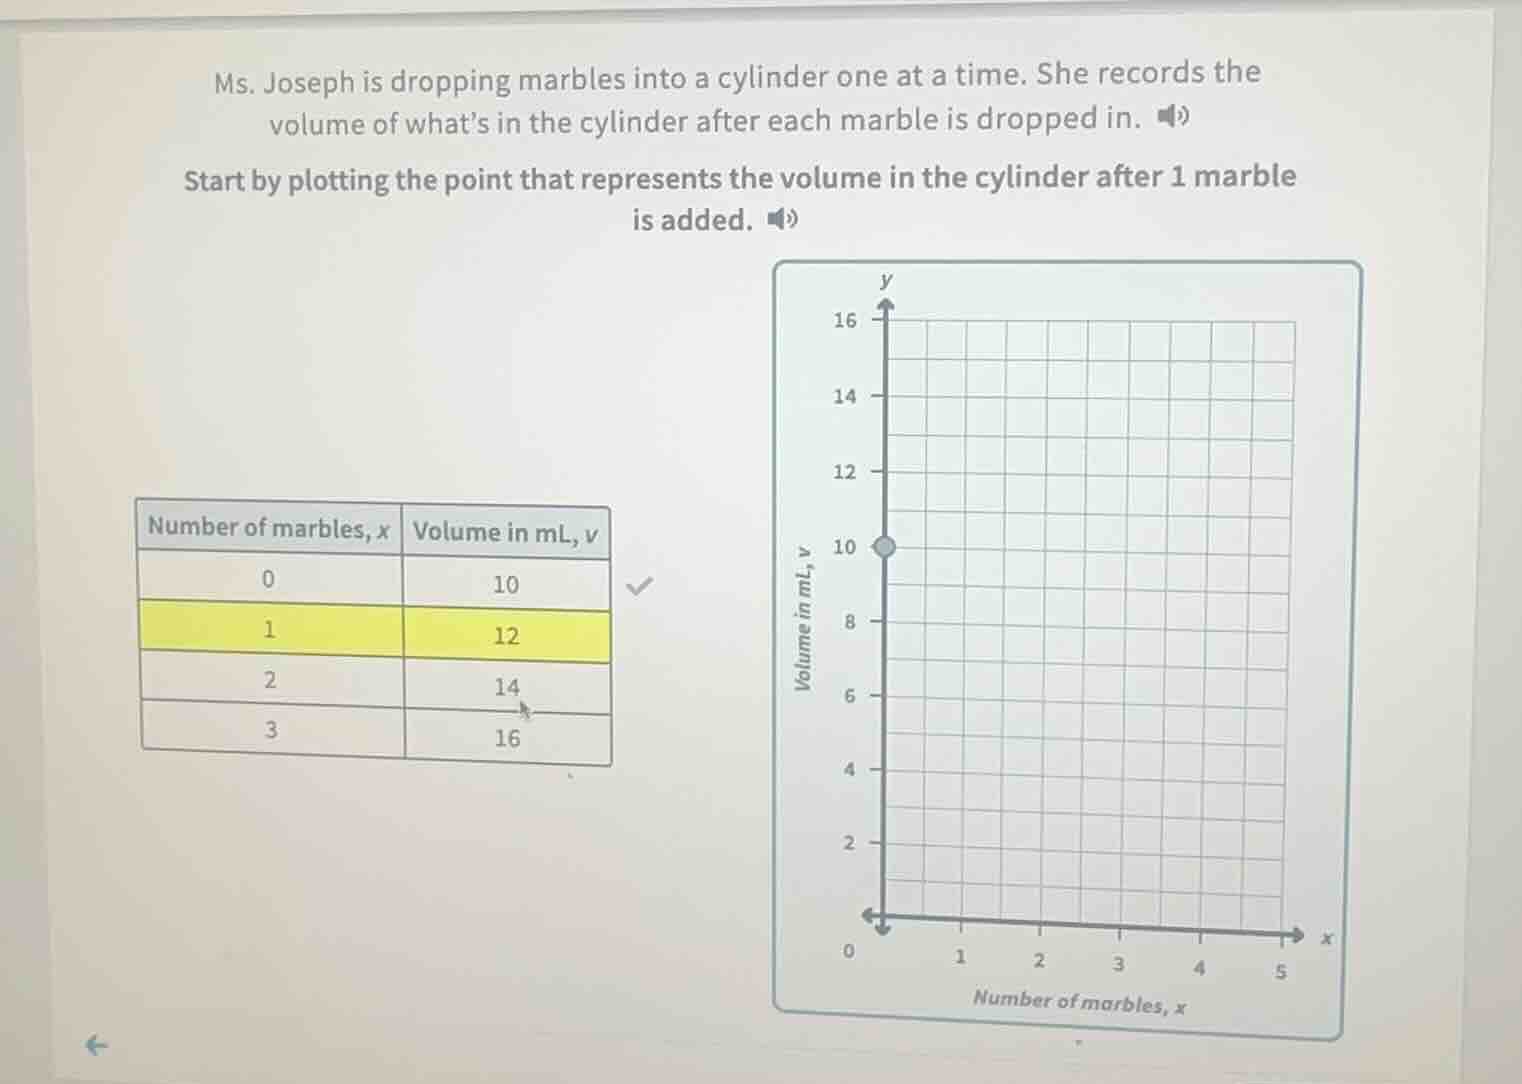
ms. joseph is dropping marbles into a cylinder one at a time. she records the volume of what’s in the cylinder after each marble is dropped in. start by plotting the point that represents the volume in the cylinder after 1 marble is added. number of marbles, x volume in ml, v 0 10 1 12 2 14 3 16 (chart: x - axis: number of marbles, x; y - axis: volume in ml, v. grid with x from 0 to 5 and y from 0 to 16. point at (0,10) marked.)
Step1: Identify target data point
From the table, when $x=1$ (1 marble), $v=12$ mL.
Step2: Locate coordinates on graph
On the x-axis, find $x=1$; on the y-axis, find $y=12$. The point is $(1, 12)$.

Snap & solve any problem in the app
Get step-by-step solutions on Sovi AI
Photo-based solutions with guided steps
Explore more problems and detailed explanations
Plot the point at the intersection of $x=1$ (horizontal axis) and $y=12$ (vertical axis) on the provided grid.