QUESTION IMAGE
Question
name date 2-5-26 period 5
cool down
lesson 5: introduction to linear relationships
cool down: stacking more cups
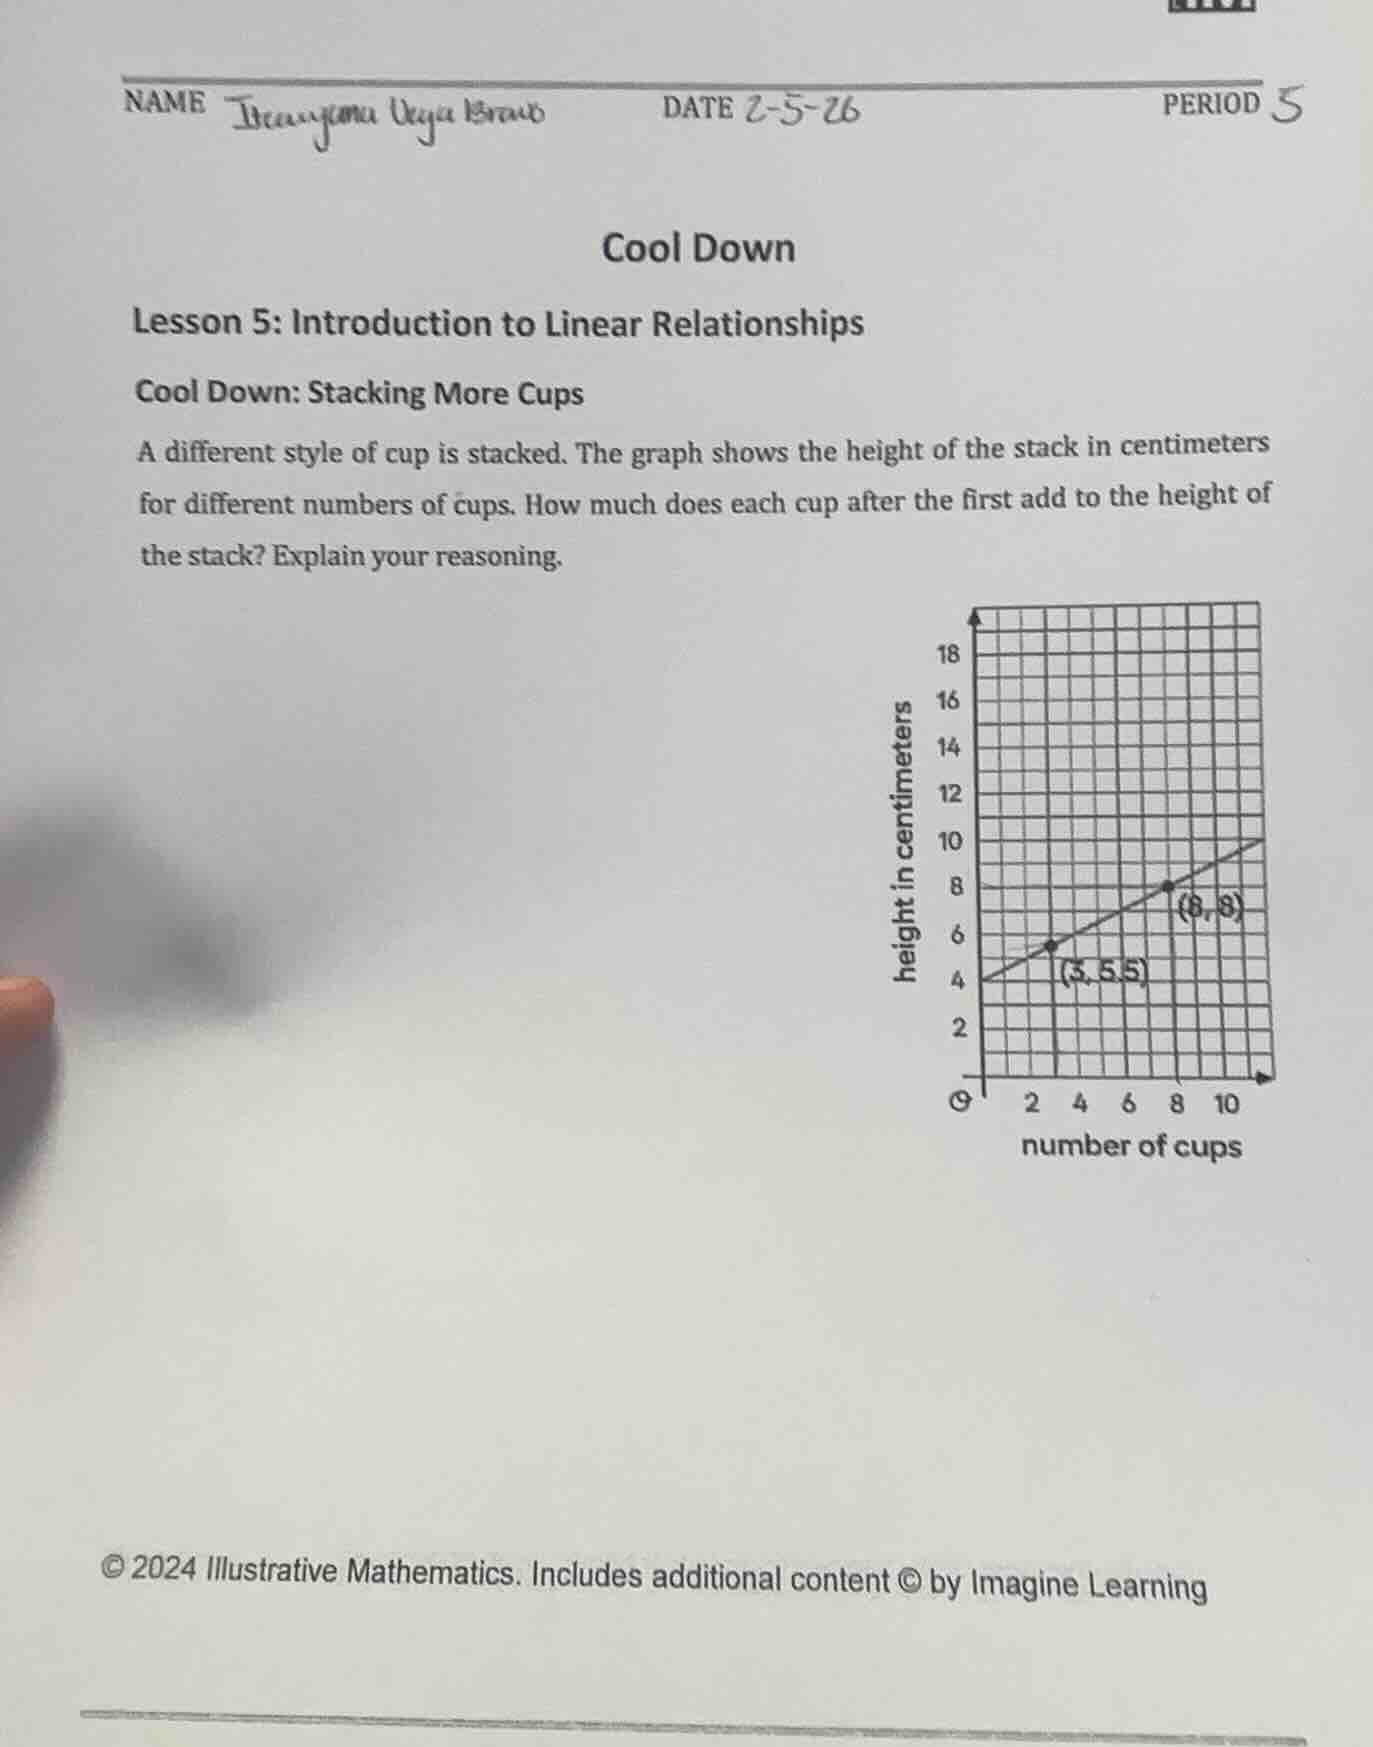
a different style of cup is stacked. the graph shows the height of the stack in centimeters for different numbers of cups. how much does each cup after the first add to the height of the stack? explain your reasoning.
© 2024 illustrative mathematics. includes additional content © by imagine learning
Step1: Identify two points
We have two points on the line: \((3, 5.5)\) and \((8, 8)\). Let the number of cups be \(x\) and height be \(y\).
Step2: Calculate the slope
The slope \(m\) of a line passing through two points \((x_1,y_1)\) and \((x_2,y_2)\) is given by \(m=\frac{y_2 - y_1}{x_2 - x_1}\). Substituting \(x_1 = 3,y_1=5.5,x_2 = 8,y_2 = 8\), we get \(m=\frac{8 - 5.5}{8 - 3}=\frac{2.5}{5}=0.5\). The slope represents the rate of change of height with respect to the number of cups, which is the height added by each additional cup (after the first).

Snap & solve any problem in the app
Get step-by-step solutions on Sovi AI
Photo-based solutions with guided steps
Explore more problems and detailed explanations
Each cup after the first adds \(0.5\) centimeters (or \(\frac{1}{2}\) centimeter) to the height of the stack.