QUESTION IMAGE
Question
name: kayleigh hotaxhlie
period: 5th
date: 1/16/20
hs.l4u1.27
developing & using
models; analyzing &
interpreting data;
communicating
information
cause & effect;
structure & function
lesson 6: virtual urchin lab (part 2)
unit 2: homeostasis; assessment #1
page 20
activity b - ocean acidification
directions: visit this website: https://depts.washington.edu/vurchin/
click on “our acidifying ocean.” then click the arrow at the bottom right of the introductory slide. proceed through thesslides by clicking this same arrow while following along with the questions below.
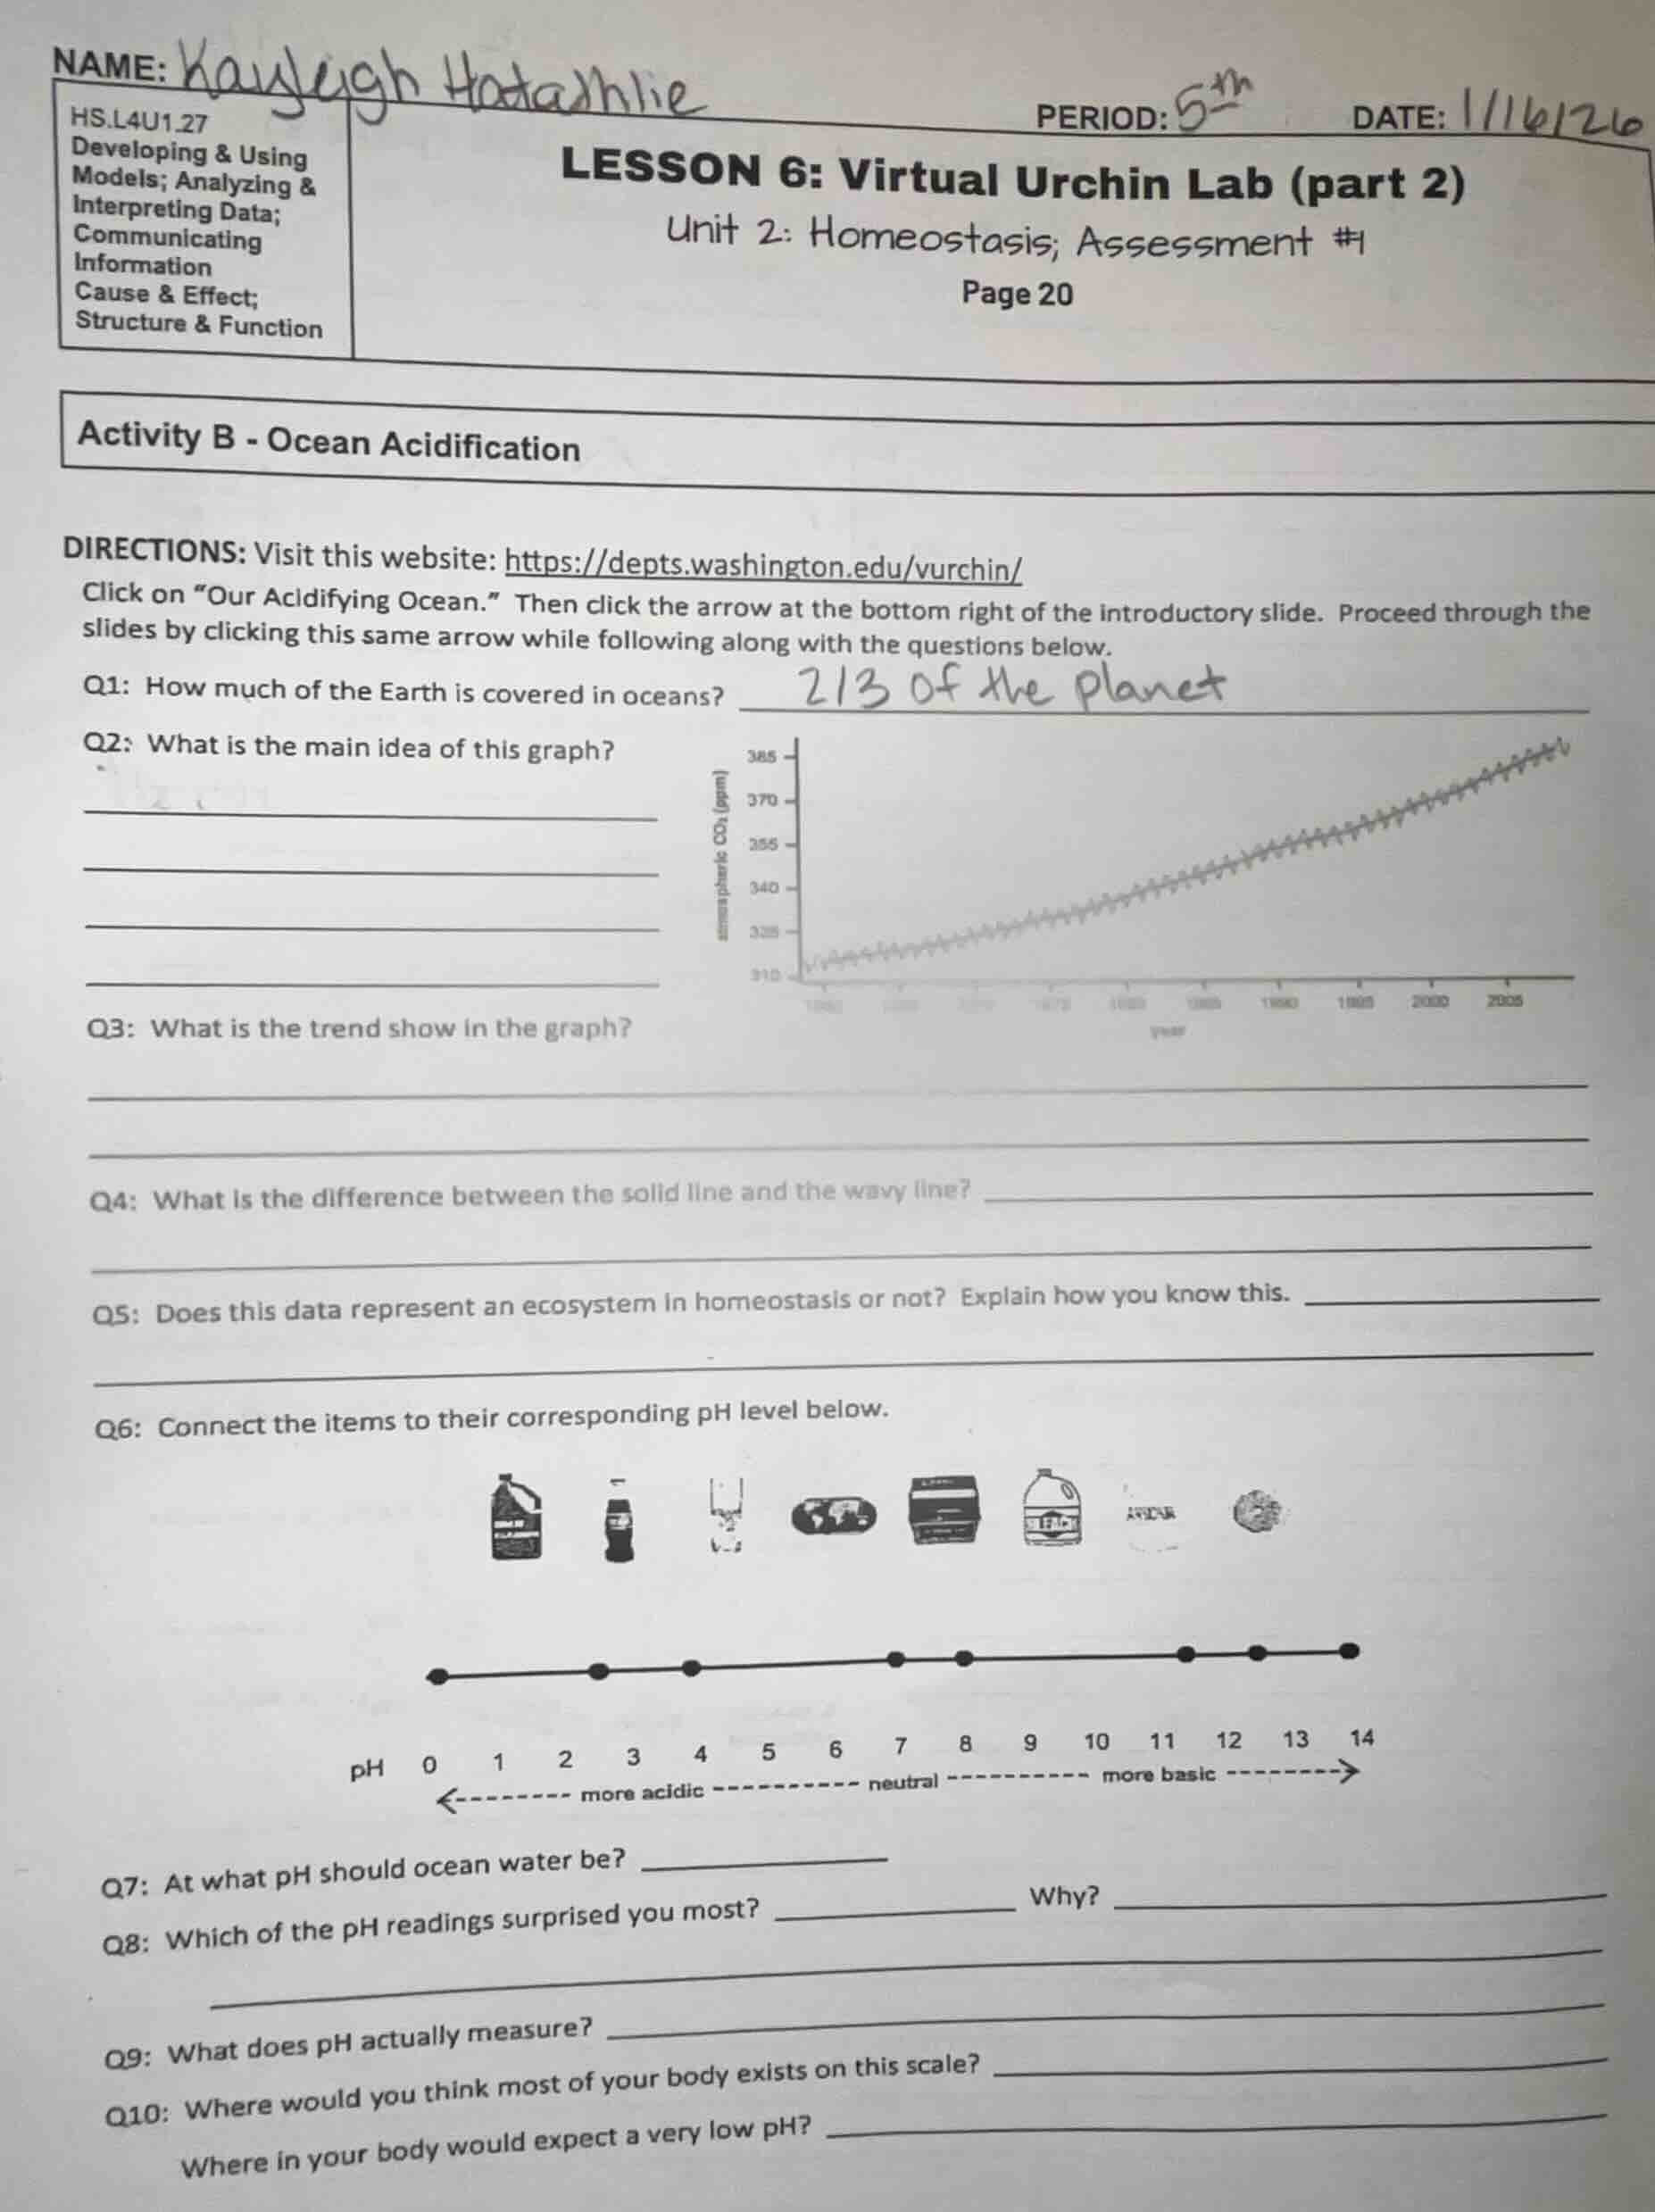
q1: how much of the earth is covered in oceans?
q2: what is the main idea of this graph?
q3: what is the trend show in the graph?
q4: what is the difference between the solid line and the wavy line?
q5: does this data represent an ecosystem in homeostasis or not? explain how you know this.
q6: connect the items to their corresponding ph level below.
q7: at what ph should ocean water be?
q8: which of the ph readings surprised you most? why?
q9: what does ph actually measure?
q10: where would you think most of your body exists on this scale?
where in your body would expect a very low ph?
Q1: Standard scientific data on Earth's ocean coverage.
Q2: The graph tracks atmospheric CO₂ over time.
Q3: Observe the overall direction of the plotted data.
Q4: Differentiate between raw and averaged data lines.
Q5: Homeostasis requires stable conditions; compare to the trend.
Q6: Match common items to known pH values: battery acid (pH 0), cola (pH 3), vinegar (pH 4), ocean (pH 8), baking soda (pH 9), ammonia (pH 11), bleach (pH 13)
Q7: Typical healthy ocean water pH value.
Q8: Subjective, based on common pH knowledge.
Q9: Definition of pH measurement.
Q10: Standard human body pH ranges and low pH locations.

Snap & solve any problem in the app
Get step-by-step solutions on Sovi AI
Photo-based solutions with guided steps
Explore more problems and detailed explanations
Q1: Approximately 71% (or $\frac{2}{3}$ as written) of the Earth is covered in oceans.
Q2: The graph shows atmospheric carbon dioxide (CO₂) levels (in ppm) measured over time (from ~1960 to 2005).
Q3: Atmospheric CO₂ levels show a steady, consistent upward increasing trend over the measured time period.
Q4: The wavy line represents raw, daily atmospheric CO₂ measurements, while the solid line represents the smoothed, annual average of those measurements.
Q5: No, this ecosystem is not in homeostasis. Homeostasis requires a stable, relatively constant state, but the data shows atmospheric CO₂ (a key ocean ecosystem driver) is steadily increasing, meaning ocean conditions (like pH) are changing, not stable.
Q6:
- Battery acid: pH 0
- Cola: pH 3
- Vinegar: pH 4
- Ocean: pH 8
- Baking soda: pH 9
- Ammonia: pH 11
- Bleach: pH 13
Q7: Ocean water should be approximately pH 8.1 (a slightly basic level).
Q8: Example: The pH of cola (pH 3) surprised me most, because it is much more acidic than I expected, close to the acidity of vinegar. (This is subjective; answers vary.)
Q9: pH measures the concentration of hydrogen ions ($H^+$) in a solution, indicating how acidic or basic the solution is.
Q10: Most of the human body exists around pH 7.4 (slightly basic, near the neutral 7 mark on the scale). A very low pH (acidic) is expected in the stomach (around pH 1-3), where stomach acid aids digestion.