QUESTION IMAGE
Question
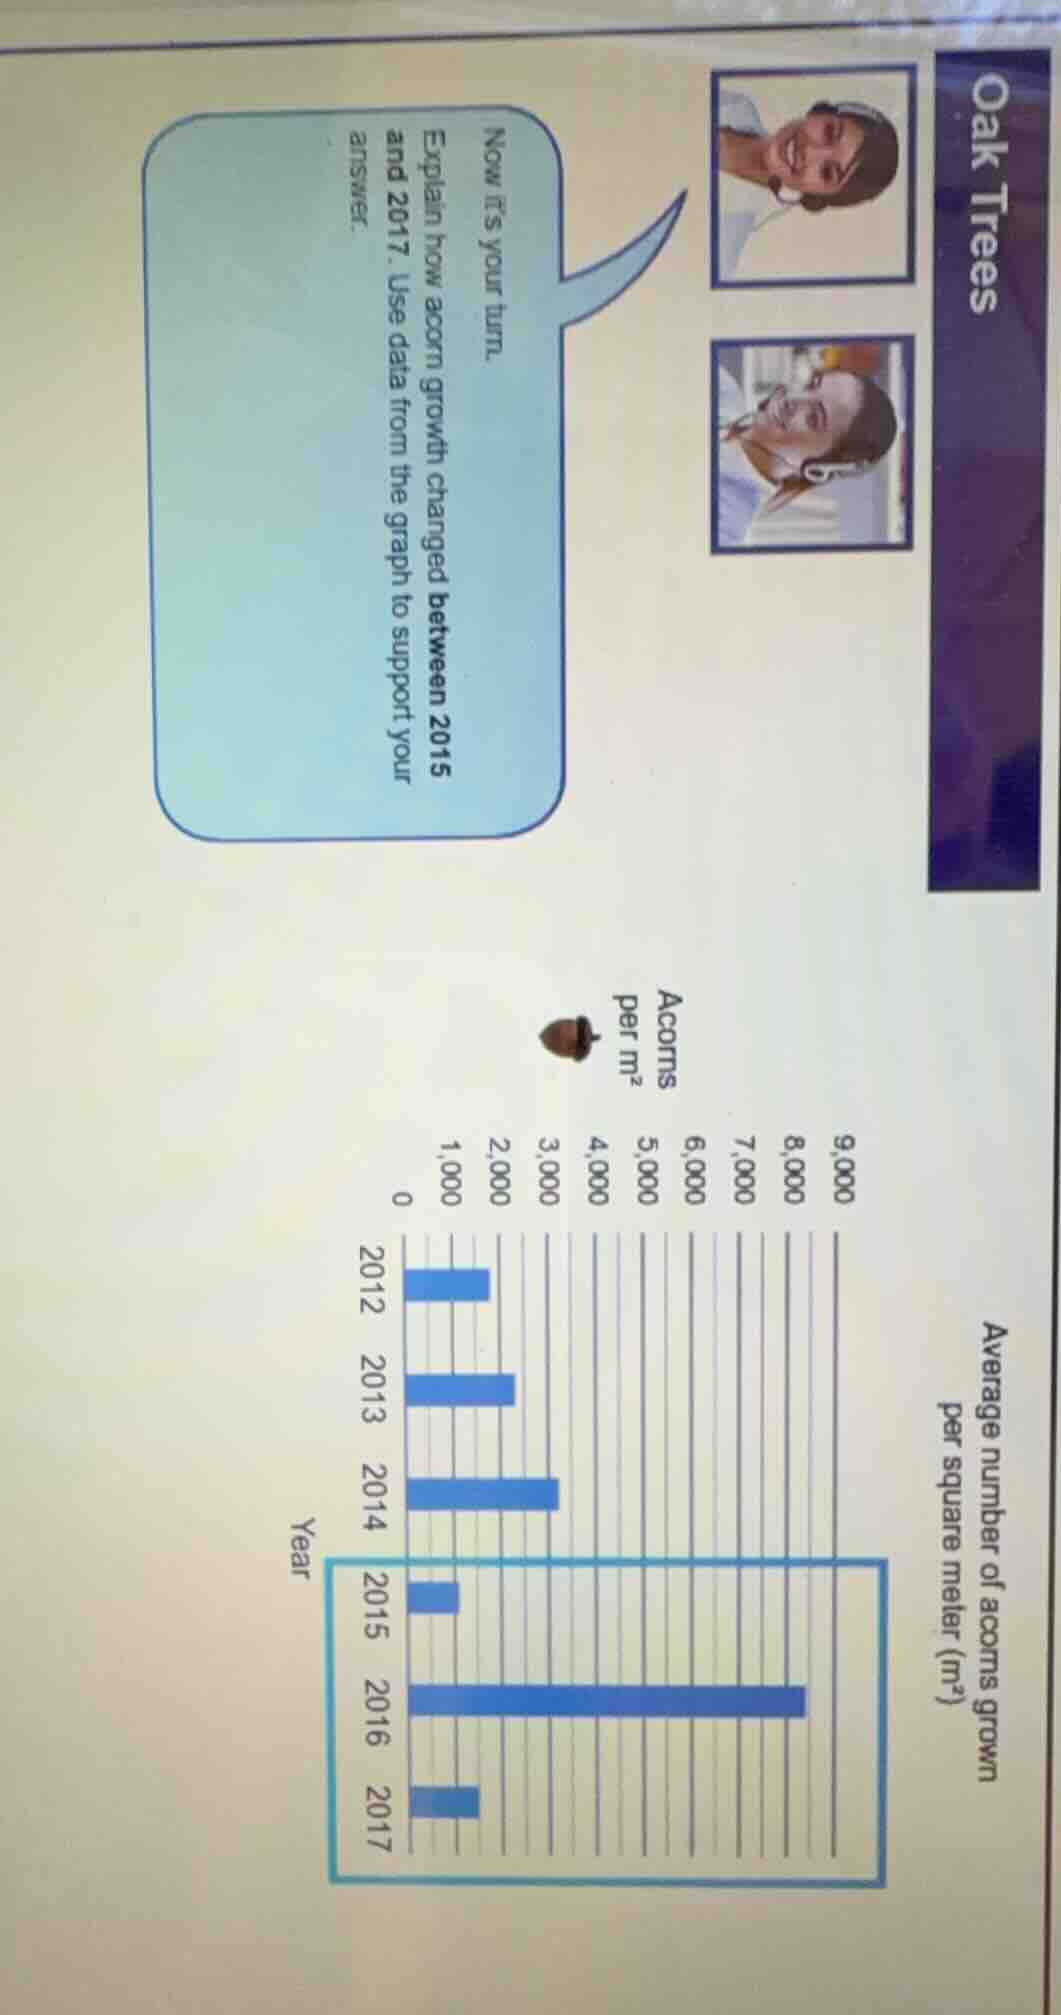
oak trees now its your turn. explain how acorn growth changed between 2015 and 2017. use data from the graph to support your answer. average number of acorns grown per square meter (m²) year 2012 2013 2014 2015 2016 2017 acorns per m² 0 1,000 2,000 3,000 4,000 5,000 6,000 7,000 8,000 9,000
Brief Explanations
- First, identify the acorn count for each year from the bar graph:
- 2015: ~1,000 acorns per m²
- 2016: ~8,000 acorns per m²
- 2017: ~1,000 acorns per m²
- Describe the trend: Between 2015 and 2016, acorn growth had a massive increase, jumping from ~1,000 to ~8,000 per m². Then between 2016 and 2017, acorn growth dropped back to the 2015 level of ~1,000 per m². Overall, it spiked in 2016 after a low in 2015, then returned to that low in 2017.

Snap & solve any problem in the app
Get step-by-step solutions on Sovi AI
Photo-based solutions with guided steps
Explore more problems and detailed explanations
Between 2015 and 2017, acorn growth first experienced a dramatic increase, then a sharp drop. In 2015, the average number of acorns per m² was ~1,000; this rose to a peak of ~8,000 per m² in 2016, before falling back to ~1,000 per m² in 2017, returning to the 2015 level.