QUESTION IMAGE
Question
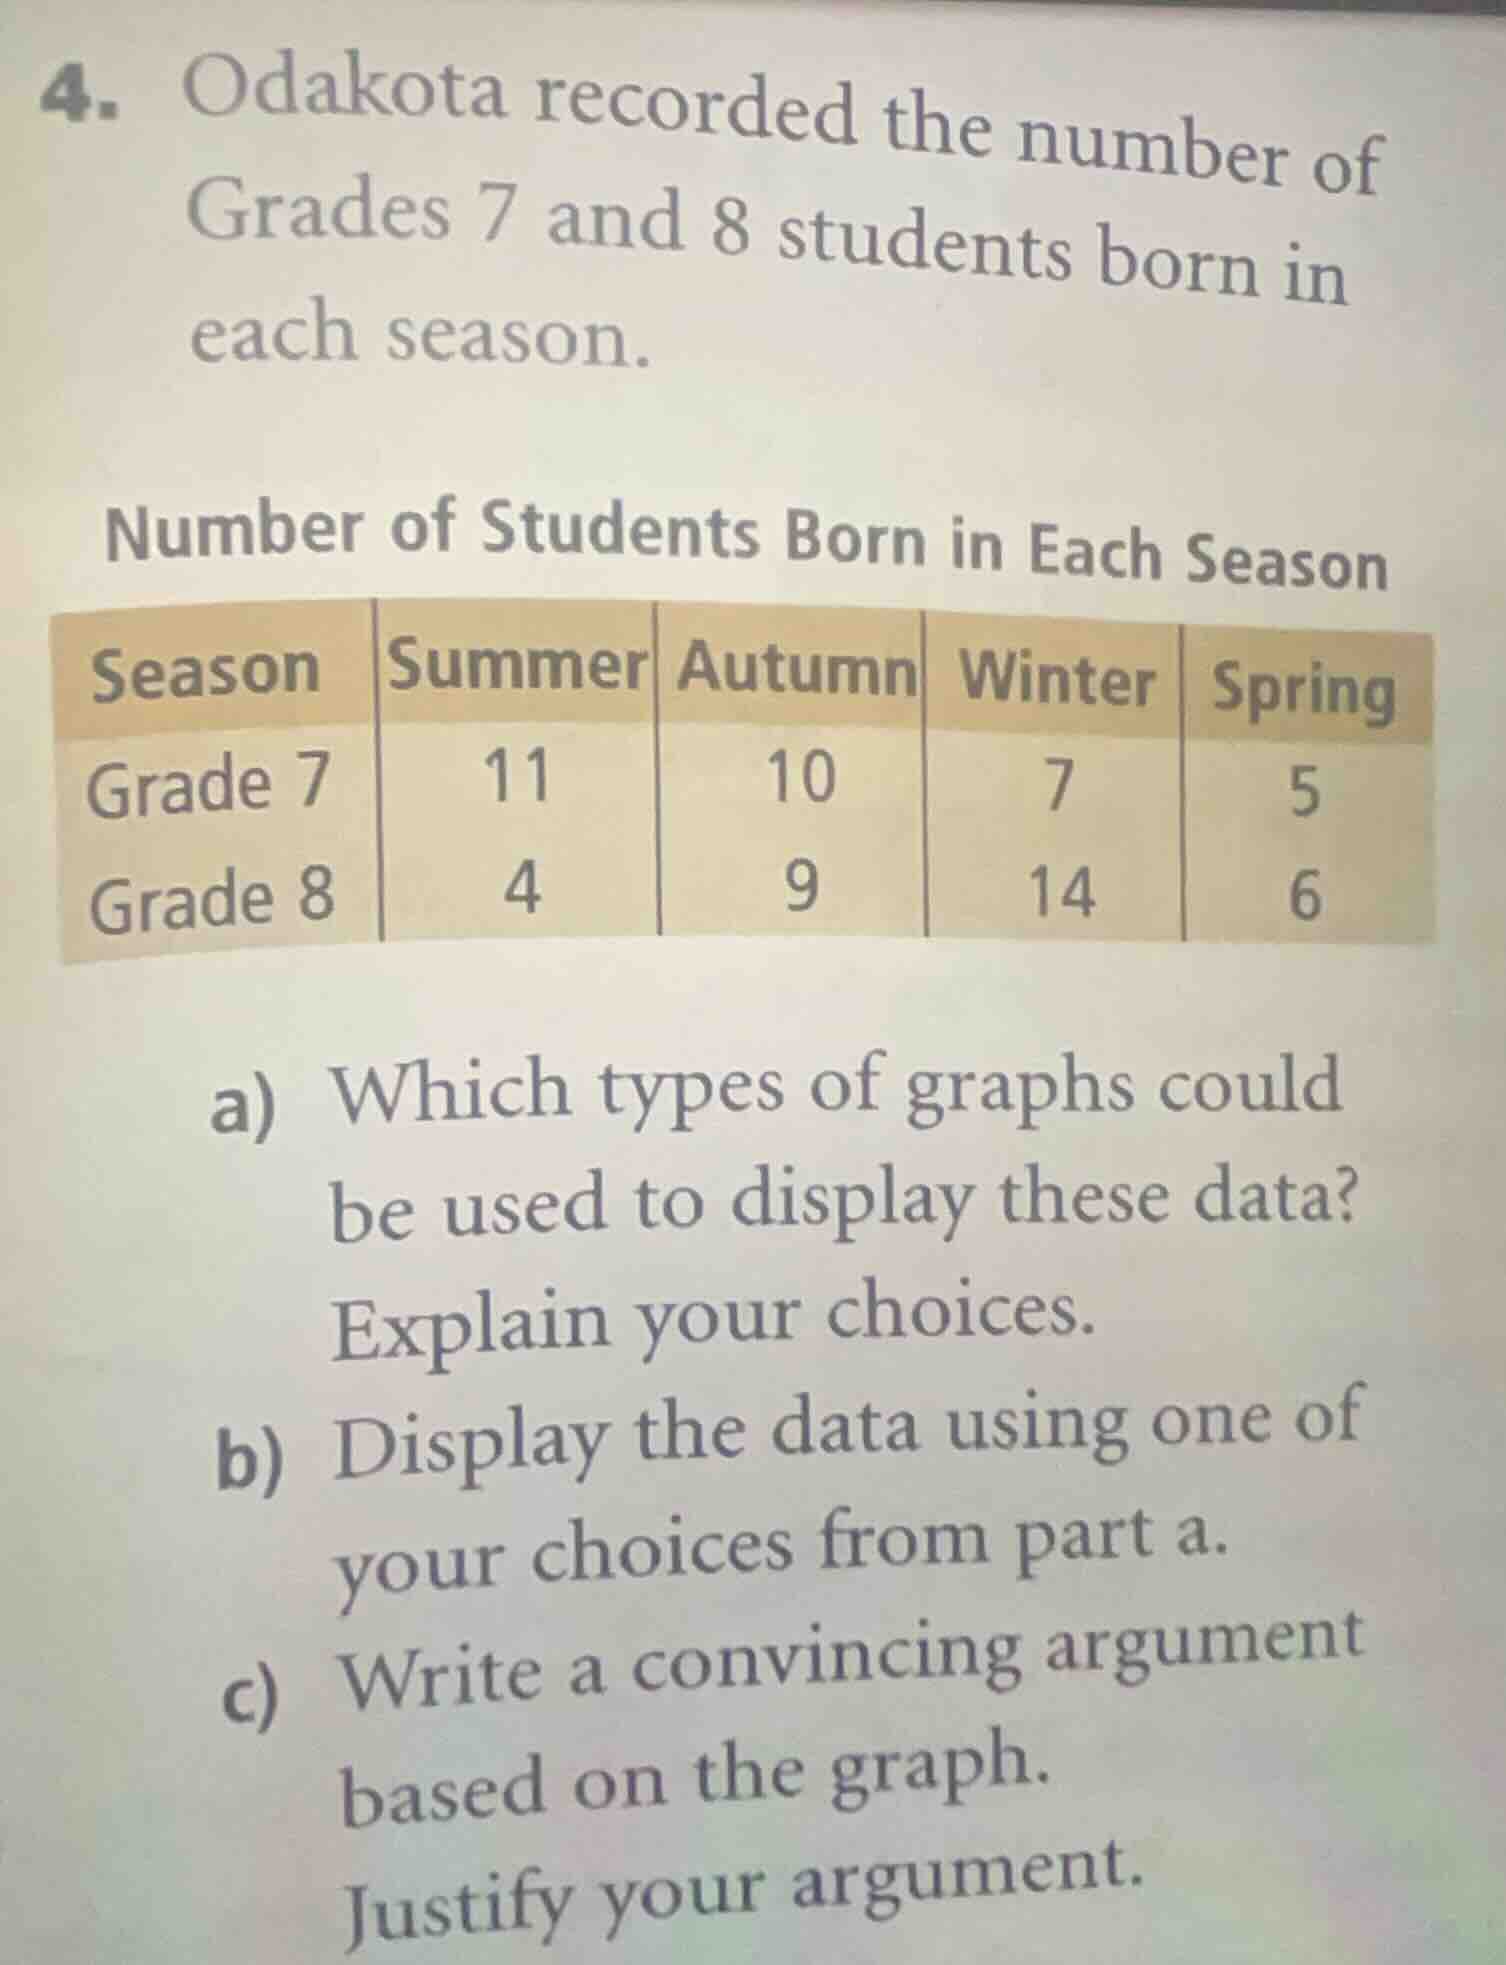
- odakota recorded the number of grades 7 and 8 students born in each season.
number of students born in each season
| season | summer | autumn | winter | spring |
|---|---|---|---|---|
| grade 8 | 4 | 9 | 14 | 6 |
a) which types of graphs could be used to display these data? explain your choices.
b) display the data using one of your choices from part a.
c) write a convincing argument based on the graph. justify your argument.
Part a
- Double Bar Graph: This graph can compare the number of Grade 7 and Grade 8 students across each season, as it allows side-by-side bars for each grade within each season category, making group comparisons clear.
- Stacked Bar Graph: This graph can show the total number of students (Grades 7 + 8) born in each season, while also displaying the breakdown between the two grades within each season.
- Grouped Bar Graph: Identical in function to the double bar graph, it organizes data by season, with paired bars for each grade to highlight differences between the two grade levels per season.
Part b
A double bar graph is created with:
- X-axis labeled "Season" (Summer, Autumn, Winter, Spring)
- Y-axis labeled "Number of Students" (scaled from 0 to 15)
- For each season, two bars: one for Grade 7 (e.g., blue) and one for Grade 8 (e.g., orange), with heights matching the table values:
- Summer: Grade 7 = 11, Grade 8 = 4
- Autumn: Grade 7 = 10, Grade 8 = 9
- Winter: Grade 7 = 7, Grade 8 = 14
- Spring: Grade 7 = 5, Grade 8 = 6
In text form, the graph can be represented as:
| Season | Grade 7 Bar Height | Grade 8 Bar Height |
|---|---|---|
| Autumn | 10 | 9 |
| Winter | 7 | 14 |
| Spring | 5 | 6 |
Part c
Argument: Grade 8 has a significantly higher number of students born in Winter compared to Grade 7, while Grade 7 has far more students born in Summer than Grade 8.
Justification: From the double bar graph, Grade 8 has 14 Winter-born students, which is 7 more than Grade 7's 7 Winter-born students. Conversely, Grade 7 has 11 Summer-born students, which is 7 more than Grade 8's 4 Summer-born students. These are the largest gaps between the two grades across all seasons, showing a clear difference in birth season distributions for the two grade levels.

Snap & solve any problem in the app
Get step-by-step solutions on Sovi AI
Photo-based solutions with guided steps
Explore more problems and detailed explanations
a) Suitable graphs include:
- Double/Grouped Bar Graph: Ideal for comparing the number of Grade 7 and Grade 8 students across each season with side-by-side bars.
- Stacked Bar Graph: Useful for showing total students per season while breaking down the count by grade.
b) (Text representation of double bar graph as shown in the table above; a visual graph would have paired bars for each season with heights matching the table values.)
c) Argument: Grade 8 has far more Winter-born students, while Grade 7 has more Summer-born students.
Justification: Grade 8 has 14 Winter-born students (7 more than Grade 7's 7), and Grade 7 has 11 Summer-born students (7 more than Grade 8's 4), the largest gaps between the two grades across all seasons.