QUESTION IMAGE
Question
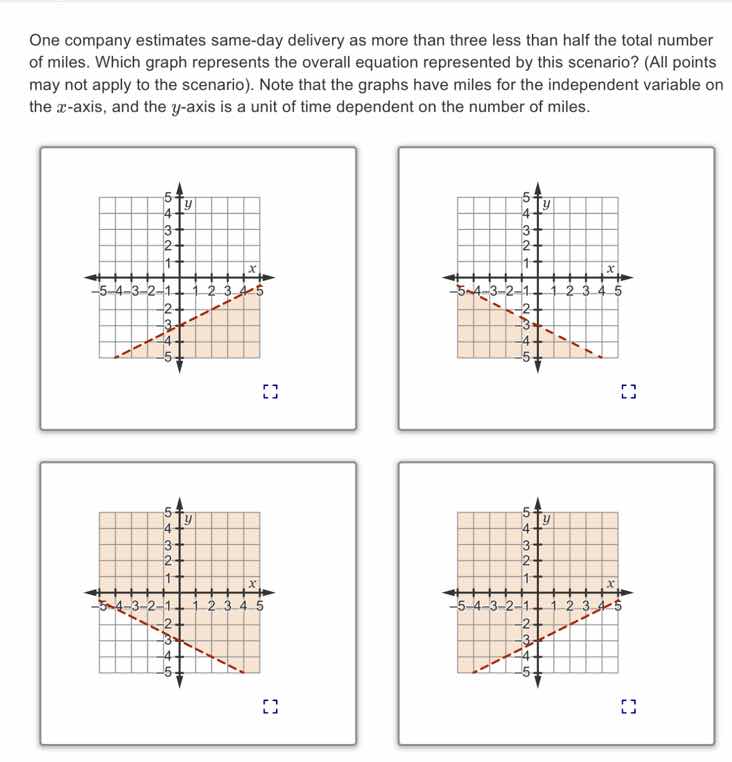
one company estimates same - day delivery as more than three less than half the total number of miles. which graph represents the overall equation represented by this scenario? (all points may not apply to the scenario). note that the graphs have miles for the independent variable on the x - axis, and the y - axis is a unit of time dependent on the number of miles.
Step1: Translate the scenario into an inequality
Let \( x \) be the number of miles (independent variable, x - axis) and \( y \) be the time (dependent variable, y - axis). The scenario says "same - day delivery as more than three less than half the total number of miles". So the inequality is \( y>\frac{1}{2}x - 3 \).
Step2: Analyze the slope and y - intercept of the boundary line
The boundary line of the inequality \( y>\frac{1}{2}x - 3 \) is \( y=\frac{1}{2}x - 3 \), which is a linear equation in slope - intercept form \( y = mx + b \), where the slope \( m=\frac{1}{2}\) (positive, so the line should be increasing) and the y - intercept \( b=- 3 \) (the line crosses the y - axis at \( (0,-3) \)). Also, since the inequality is \( y>\frac{1}{2}x - 3 \), the boundary line should be dashed (because the inequality is strict, \(>\) not \(\geq\)) and we shade the region above the line.
Step3: Analyze each graph
- For a line with slope \(\frac{1}{2}\), as \( x \) increases by 2, \( y \) increases by 1. The y - intercept is - 3. Let's check the graphs:
- The first graph: The line has a positive slope, y - intercept around - 3, dashed line, and shading above the line. This matches our inequality \( y>\frac{1}{2}x - 3 \).
- The second graph: The line has a negative slope, so it does not match the slope of \(\frac{1}{2}\).
- The third graph: The line has a negative slope, so it does not match the slope of \(\frac{1}{2}\).
- The fourth graph: The line has a positive slope, but let's check the y - intercept. If we look at the line, when \( x = 0\), the y - intercept seems to be - 3? Wait, no, let's check the direction of shading. Wait, no, in the fourth graph, the shading is below the line? Wait, no, let's re - evaluate. Wait, the inequality is \( y>\frac{1}{2}x - 3 \), so we shade above the line. The first graph has a dashed line with positive slope, y - intercept - 3, and shading above the line. The fourth graph: Let's check the slope. If we take two points on the line, say when \( x = 4\), \( y=-1\); when \( x = 0\), \( y = - 3\). The slope \( m=\frac{-1-(-3)}{4 - 0}=\frac{2}{4}=\frac{1}{2}\). Wait, but the shading: in the fourth graph, is the shading above or below? Wait, the problem says "all points may not apply to the scenario". Wait, no, the first graph: the line is \( y=\frac{1}{2}x - 3\), dashed, shading above. The fourth graph: let's see, when \( x = 0\), \( y=-3\), when \( x = 4\), \( y=-1\). The line is \( y=\frac{1}{2}x - 3\). But the shading: in the first graph, the shading is above the line, in the fourth graph, the shading is below? Wait, no, maybe I made a mistake. Wait, the inequality is \( y>\frac{1}{2}x - 3\), so for a point like \( (0,0)\), plug into the inequality: \( 0>\frac{1}{2}(0)-3\), \( 0>- 3\), which is true. So \( (0,0)\) should be in the shaded region. Let's check the first graph: \( (0,0)\) is in the shaded region (above the line \( y=\frac{1}{2}x - 3\), when \( x = 0\), \( y=-3\), so \( (0,0)\) is above \( y=-3\) and for \( x = 0\), \( 0>\frac{1}{2}(0)-3\) is true). In the fourth graph, \( (0,0)\): let's see the line, when \( x = 0\), \( y=-3\), the line in the fourth graph: if we take \( x = 0\), \( y=-3\), \( x = 4\), \( y=-1\). The point \( (0,0)\): is it above or below the line? The line at \( x = 0\) is \( y=-3\), so \( (0,0)\) is above the line. Wait, but the shading in the fourth graph: the shaded area includes \( (0,0)\)? Wait, maybe I confused the first and fourth. Wait, no, let's check the slope again. The first graph: when \( x = 4\), \( y=\frac{1}{2}(4)-3=2 - 3=-1\). So th…

Snap & solve any problem in the app
Get step-by-step solutions on Sovi AI
Photo-based solutions with guided steps
Explore more problems and detailed explanations
The graph in the top - left (the first graph) represents the equation \( y>\frac{1}{2}x - 3\) which is the scenario given.