QUESTION IMAGE
Question
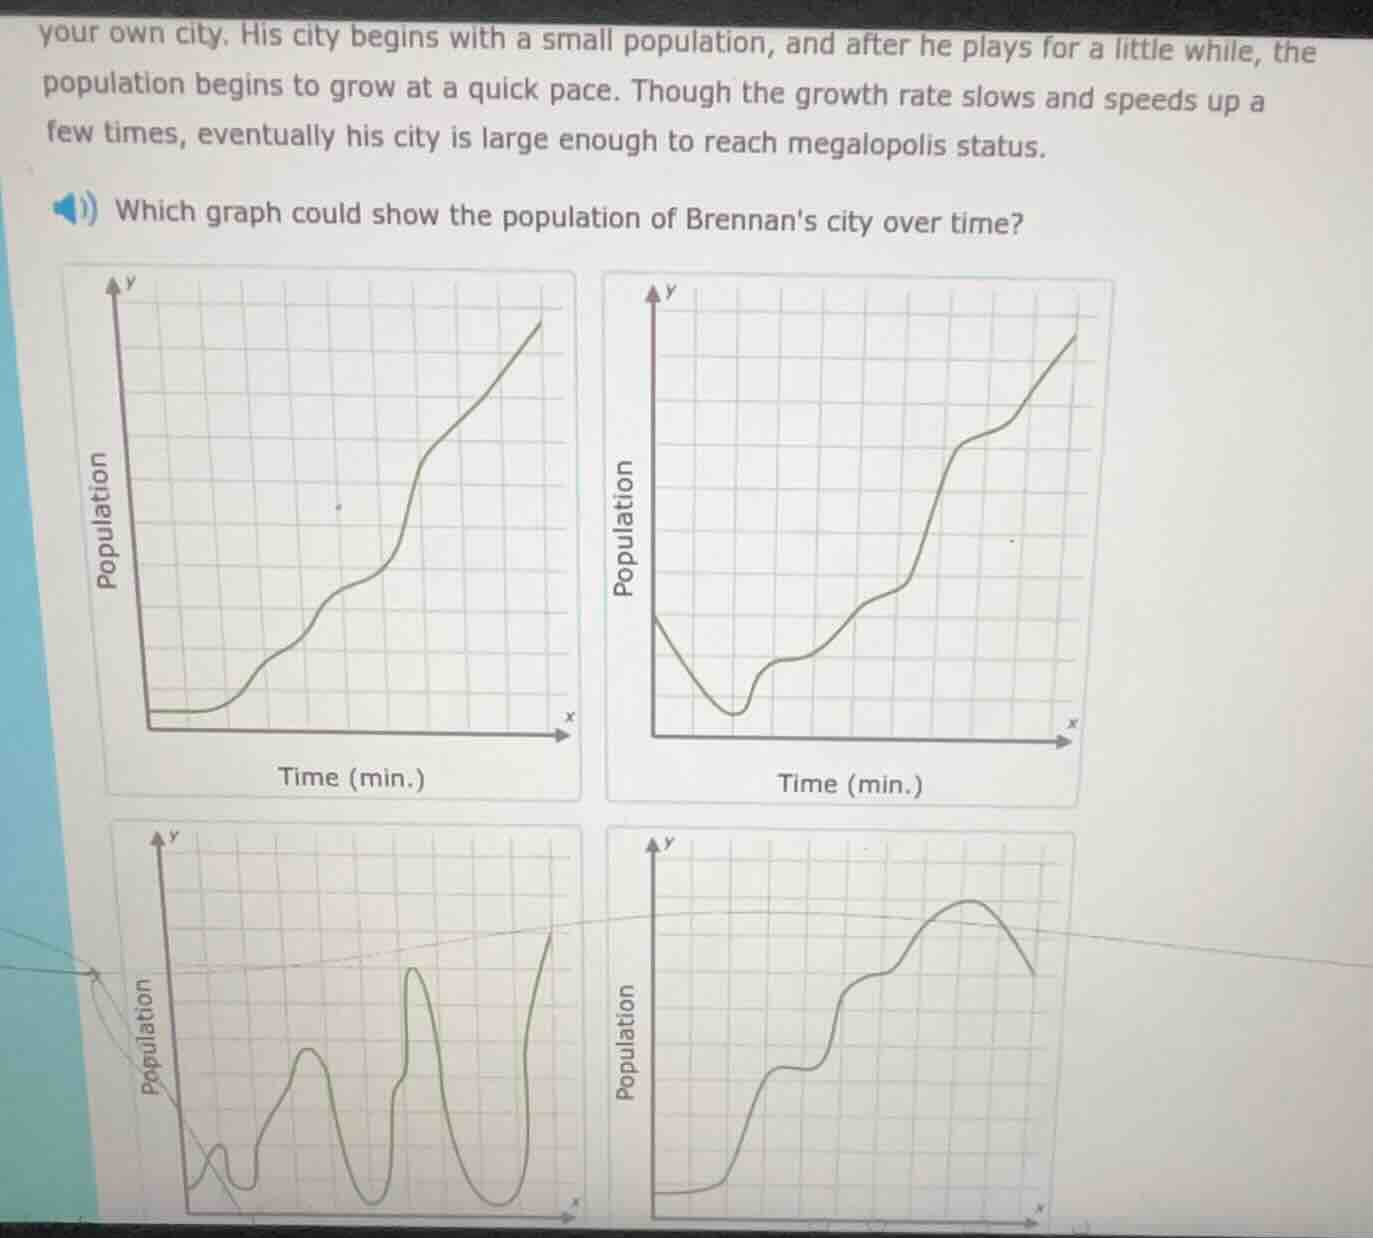
your own city. his city begins with a small population, and after he plays for a little while, the population begins to grow at a quick pace. though the growth rate slows and speeds up a few times, eventually his city is large enough to reach megalopolis status. which graph could show the population of brennans city over time?
The population starts small, then grows (with speed slowing/speeding up at times) but never decreases, and ends at a large size. The top-left graph starts low, only increases (with changing slopes to show varying growth rates), and rises to a high value, matching the description. Other graphs have population drops, which do not fit the scenario.

Snap & solve any problem in the app
Get step-by-step solutions on Sovi AI
Photo-based solutions with guided steps
Explore more problems and detailed explanations
Top-left graph (starts at low population, increases continuously with varying growth rates, ends at high population)