QUESTION IMAGE
Question
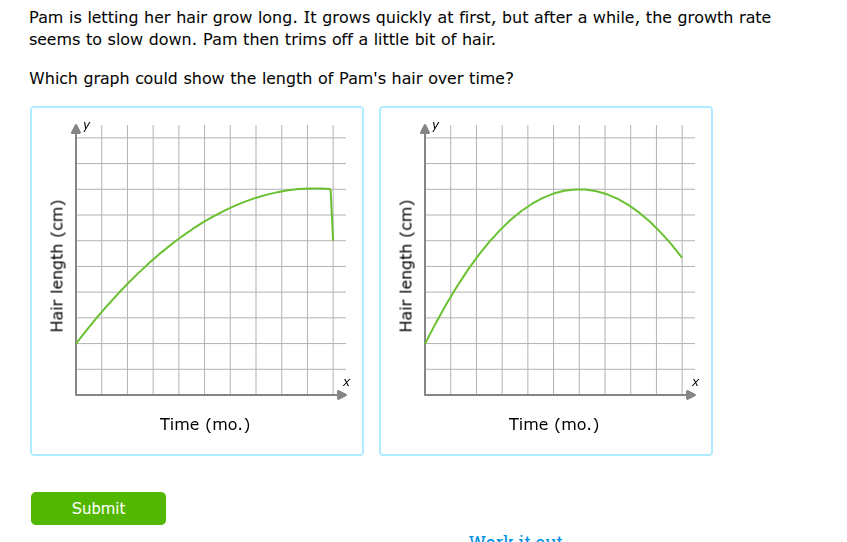
pam is letting her hair grow long. it grows quickly at first, but after a while, the growth rate seems to slow down. pam then trims off a little bit of hair. which graph could show the length of pams hair over time?
Brief Explanations
- Analyze the hair growth process: First, hair grows quickly (steep initial slope), then growth slows (slope becomes less steep). Then Pam trims, so length drops suddenly (vertical or steep drop).
- Compare the two graphs:
- Left graph: Increases with decreasing slope (matches growth slowing), then a sudden drop (matches trimming).
- Right graph: After peaking, it decreases gradually (doesn't match a trim, which should be a sudden drop).
So the left graph is correct.

Snap & solve any problem in the app
Get step-by-step solutions on Sovi AI
Photo-based solutions with guided steps
Explore more problems and detailed explanations
The left graph (the one with the sudden drop after the growth phase)