QUESTION IMAGE
Question
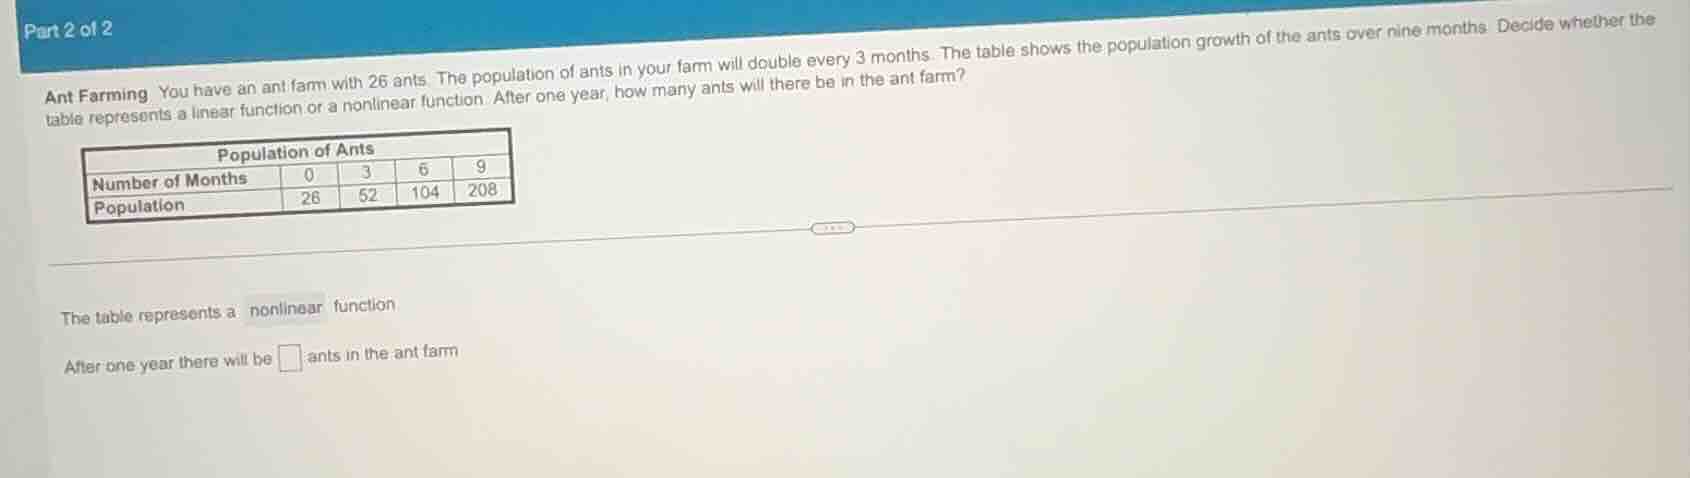
part 2 of 2
ant farming you have an ant farm with 26 ants. the population of ants in your farm will double every 3 months. the table shows the population growth of the ants over nine months. decide whether the table represents a linear function or a nonlinear function. after one year, how many ants will there be in the ant farm?
| population of ants | ||||
|---|---|---|---|---|
| population | 26 | 52 | 104 | 208 |
the table represents a nonlinear function
after one year there will be \\(\square\\) ants in the ant farm
Step1: Verify linearity (rate check)
Check population change per 3 months:
$52-26=26$, $104-52=52$, $208-104=104$
The change is not constant, so it is nonlinear.
Step2: Identify growth pattern
Population doubles every 3 months: $P(n) = 26 \times 2^{\frac{n}{3}}$, where $n$ = months.
Step3: Calculate 1-year (12 months) population
Substitute $n=12$:
$P(12) = 26 \times 2^{\frac{12}{3}} = 26 \times 2^4$
$2^4=16$, so $26 \times 16 = 416$

Snap & solve any problem in the app
Get step-by-step solutions on Sovi AI
Photo-based solutions with guided steps
Explore more problems and detailed explanations
The table represents a nonlinear function
After one year there will be 416 ants in the ant farm