QUESTION IMAGE
Question
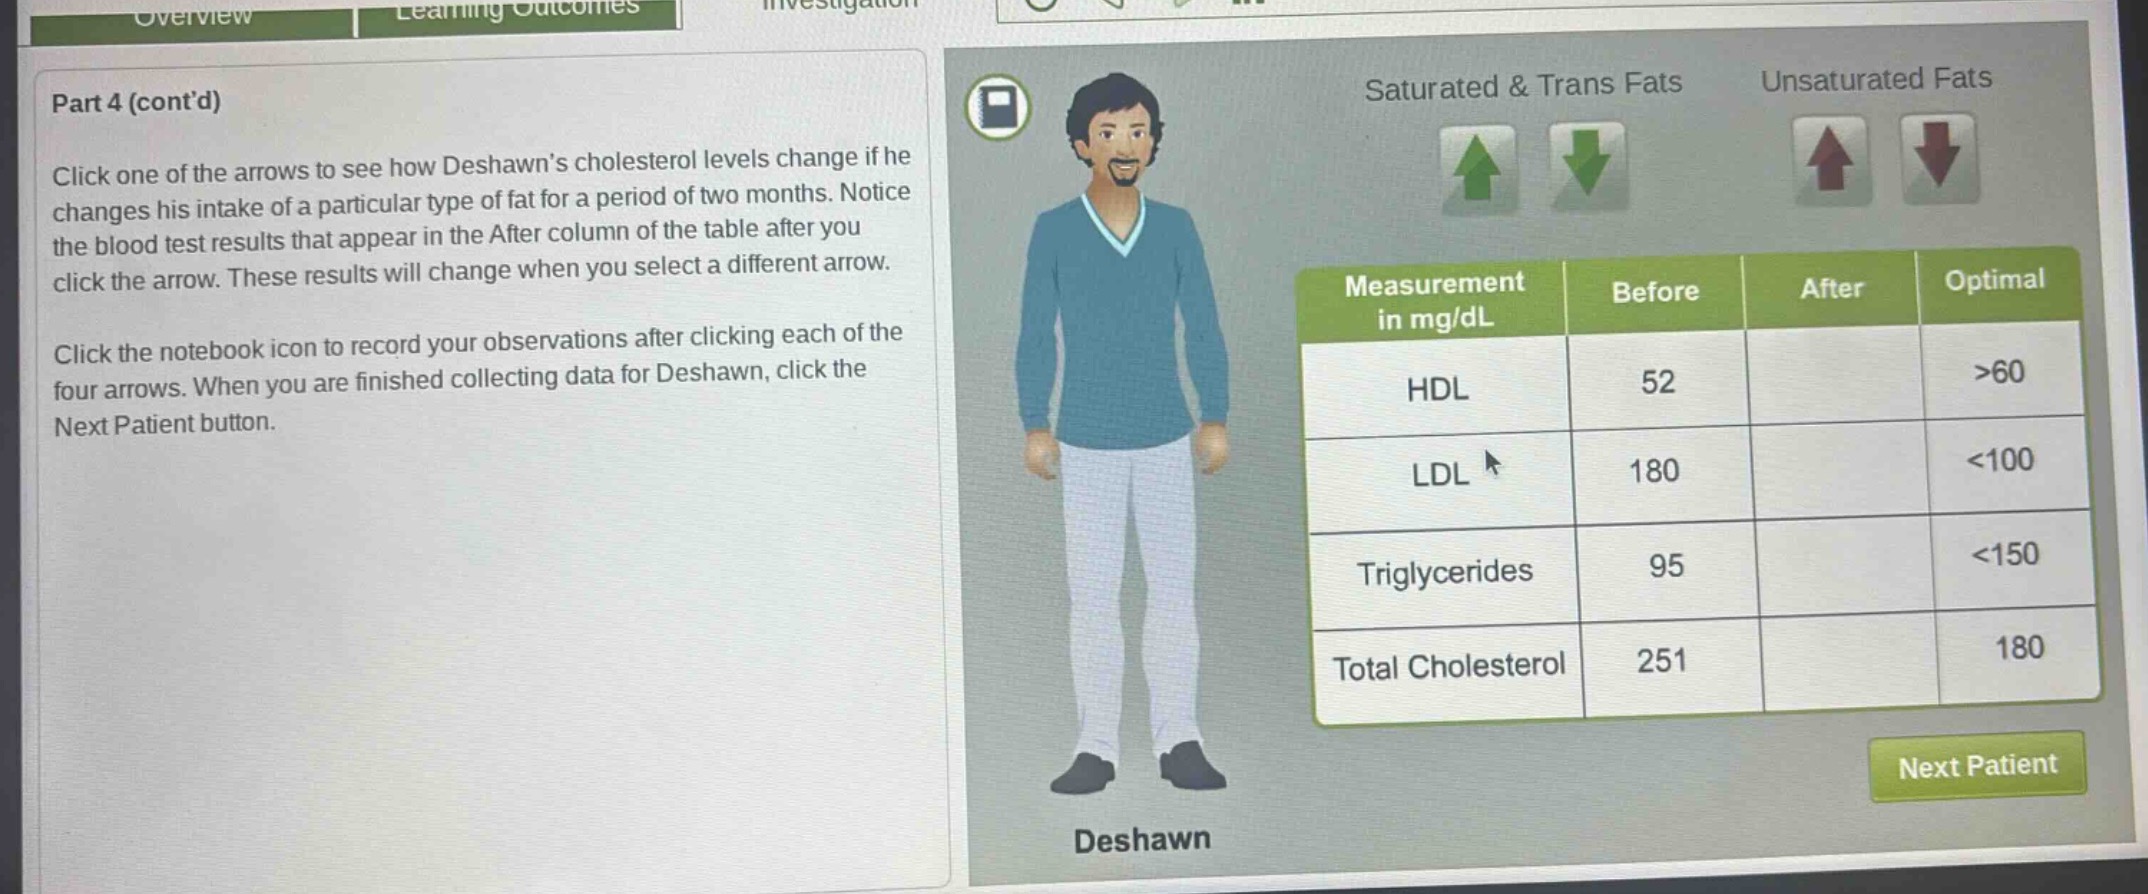
part 4 (contd)
click one of the arrows to see how deshawn’s cholesterol levels change if he changes his intake of a particular type of fat for a period of two months. notice the blood test results that appear in the after column of the table after you click the arrow. these results will change when you select a different arrow.
click the notebook icon to record your observations after clicking each of the four arrows. when you are finished collecting data for deshawn, click the next patient button.
| measurement in mg/dl | before | after | optimal |
|---|---|---|---|
| ldl | 180 | <100 | |
| triglycerides | 95 | <150 | |
| total cholesterol | 251 | 180 |
This appears to be an interactive activity related to understanding how different fat intakes (saturated/trans fats vs. unsaturated fats) affect cholesterol levels (HDL, LDL, Triglycerides, Total Cholesterol) over two months. To complete it:
Step 1: Interact with the arrows
Click the green down arrow for Saturated & Trans Fats (to decrease intake) and the red up arrow for Unsaturated Fats (to increase intake). These choices align with dietary recommendations: reducing saturated/trans fats and increasing unsaturated fats improves cholesterol profiles (e.g., lowers LDL, raises HDL, controls triglycerides and total cholesterol).
Step 2: Observe and record
After clicking each arrow, check the “After” column in the table. For example:
- HDL (good cholesterol) should increase (toward >60 mg/dL) with more unsaturated fats.
- LDL (bad cholesterol) should decrease (toward <100 mg/dL) with less saturated/trans fats.
- Triglycerides should stay within <150 mg/dL (or improve) with healthy fat changes.
- Total Cholesterol should decrease (toward 180 mg/dL) with improved fat intake.
Step 3: Complete and proceed
After testing all four arrows (green up/down for saturated/trans; red up/down for unsaturated) and recording observations, click “Next Patient” to move forward.
The key is to use the arrows to simulate dietary changes, observe the impact on cholesterol metrics, and confirm how fat types influence cardiovascular health markers.

Snap & solve any problem in the app
Get step-by-step solutions on Sovi AI
Photo-based solutions with guided steps
Explore more problems and detailed explanations
This appears to be an interactive activity related to understanding how different fat intakes (saturated/trans fats vs. unsaturated fats) affect cholesterol levels (HDL, LDL, Triglycerides, Total Cholesterol) over two months. To complete it:
Step 1: Interact with the arrows
Click the green down arrow for Saturated & Trans Fats (to decrease intake) and the red up arrow for Unsaturated Fats (to increase intake). These choices align with dietary recommendations: reducing saturated/trans fats and increasing unsaturated fats improves cholesterol profiles (e.g., lowers LDL, raises HDL, controls triglycerides and total cholesterol).
Step 2: Observe and record
After clicking each arrow, check the “After” column in the table. For example:
- HDL (good cholesterol) should increase (toward >60 mg/dL) with more unsaturated fats.
- LDL (bad cholesterol) should decrease (toward <100 mg/dL) with less saturated/trans fats.
- Triglycerides should stay within <150 mg/dL (or improve) with healthy fat changes.
- Total Cholesterol should decrease (toward 180 mg/dL) with improved fat intake.
Step 3: Complete and proceed
After testing all four arrows (green up/down for saturated/trans; red up/down for unsaturated) and recording observations, click “Next Patient” to move forward.
The key is to use the arrows to simulate dietary changes, observe the impact on cholesterol metrics, and confirm how fat types influence cardiovascular health markers.