QUESTION IMAGE
Question
part 2 of 3
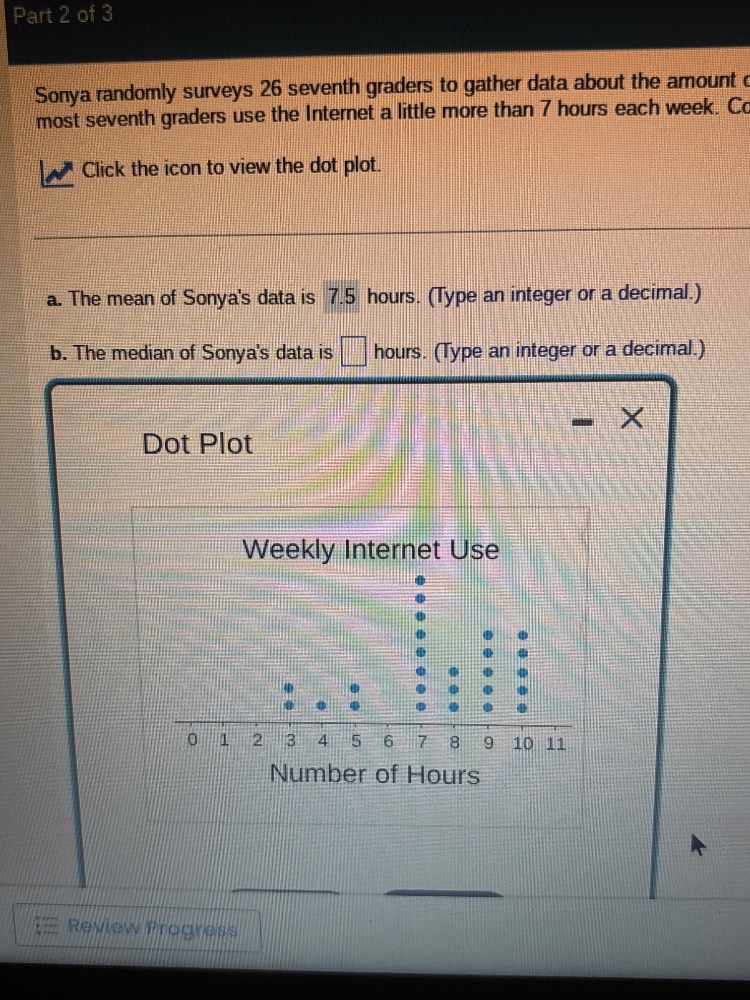
sonya randomly surveys 26 seventh graders to gather data about the amount o
most seventh graders use the internet a little more than 7 hours each week. c
click the icon to view the dot plot.
a. the mean of sonyas data is 7.5 hours. (type an integer or a decimal.)
b. the median of sonyas data is \\(\square\\) hours. (type an integer or a decimal.)
dot plot
weekly internet use
0 1 2 3 4 5 6 7 8 9 10 11
number of hours
8, 17:8, 18:8. Then position 19:9, etc. Wait, but 13th and 14th: position 13 is 7, position 14 is 7? Wait no, wait cumulative after 5 is 5. Then hour 7 has 10 dots, so positions 6 (7),7(7),...,15(7) (10 dots: 6-15). Then position 16:8, 17:8, 18:8 (3 dots: 16-18). So 13th is 7, 14th is 7? Wait no, 5 (after 5) +10 (7) =15, so positions 6-15: 10 numbers (6,7,...,15). So 13th is 7, 14th is 7. Wait but that would make median (7+7)/2=7? But wait maybe my tally is wrong. Wait maybe hour 7 has 8 dots? Let's recheck.
Alternative approach: total data points 26. Median is average of (26/2)th and (26/2 +1)th =13th and 14th. Let's count the number of dots at each hour:
- Hour 3: 2 dots
- Hour 4: 1 dot
- Hour 5: 2 dots
- Hour 7: Let's see, the dot plot: the column at 7 is the tallest. Let's assume the counts are:
3:2, 4:1, 5:2, 7:10, 8:3, 9:4, 10:4. Now cumulative:
- 3:2 (positions 1-2)
- 4:1 (position 3)
- 5:2 (positions 4-5)
- 7:10 (positions 6-15)
- 8:3 (positions 16-18)
- 9:4 (positions 19-22)
- 10:4 (positions 23-26)
Now, 13th position: within 6-15 (hour 7), so 7.
14th position: also within 6-15 (hour 7), so 7.
Wait, but that would make median 7. But wait maybe I miscounted the dots at 7. Wait maybe the dot plot for 7 has, say, 8 dots? Let's recalculate:
If 3:2, 4:1, 5:2, 7:8, 8:3, 9:4, 10:4. Then total:2+1+2+8+3+4+4=24. Missing 2, maybe hour 6 has 2? Oh! I forgot hour 6. So hour 6:2 dots. Then total:2+1+2+2+8+3+4+4=26. Now cumulative:
- 3:2 (2)
- 4:1 (3)
- 5:2 (5)
- 6:2 (7)
- 7:8 (15)
- 8:3 (18)
- 9:4 (22)
- 10:4 (26)
Now positions:
1-2:3
3:4
4-5:5
6-7:6
8-15:7 (8 dots: positions 8-15)
16-18:8
19-22:9
23-26:10
Now, 13th position: within 8-15 (hour 7), so 7.
14th position: also within 8-15 (hour 7), so 7. Wait, but 7th position is 6, 8th is 7. So 13th and 14th are both 7? Then median is (7+7)/2=7? But wait the mean is 7.5, maybe median is 7? Wait no, maybe my dot plot interpretation is wrong. Wait the original problem: "most seventh graders use the Internet a little more than 7 hours each week". So the peak is around 7-8. Wait maybe the correct count is:
Let's look at the dot plot again (as per the image):
- Hour 3: 2 dots
- Hour 4: 1 dot
- Hour 5: 2 dots
- Hour 7: let's say 7 dots
- Hour 8: 3 dots
- Hour 9: 4 dots
- Hour 10: 4 dots
- Hour 6: 0 dots
Wait no, total must be 26. Let's do it step by step:
Let’s denote the number of dots at each hour:
- 3: \( n_3 = 2 \)
- 4: \( n_4 = 1 \)
- 5: \( n_5 = 2 \)
- 7: \( n_7 \)
- 8: \( n_8 = 3 \)
- 9: \( n_9 = 4 \)
- 10: \( n_{10} = 4 \)
- 6: \( n_6 = 0 \)
Sum: \( 2 + 1 + 2 + 0 + n_7 + 3 + 4 + 4 = 2 + 1 + 2 + n_7 + 11 = 16 + n_7 = 26 \) ⇒ \( n_7 = 10 \)
So cumulative frequencies:
- Up to 3: 2
- Up to 4: 3
- Up to 5: 5
- Up to 7: 5 + 10 = 15
- Up to 8: 15 + 3 = 18
- Up to 9: 18 + 4 = 22
- Up to 10: 22 + 4 = 26
Now, the median is the average of the 13th and 14th values.
- The first 5 values (up to 5) are at hours 3,4,5.
- Then, from 6th to 15th value (10 values) are at hour 7 (since \( n_7 = 10 \)).
So the 13th and 14th values are both at hour 7.
Thus, median = \( \frac{7 + 7}{2} = 7 \)
Wait, but maybe I made a mistake. Wait, if \( n_7 = 10 \), then positions 6 to 15 are 7. So 13th and 14th are 7. So median is 7.

Snap & solve any problem in the app
Get step-by-step solutions on Sovi AI
Photo-based solutions with guided steps
Explore more problems and detailed explanations
7