QUESTION IMAGE
Question
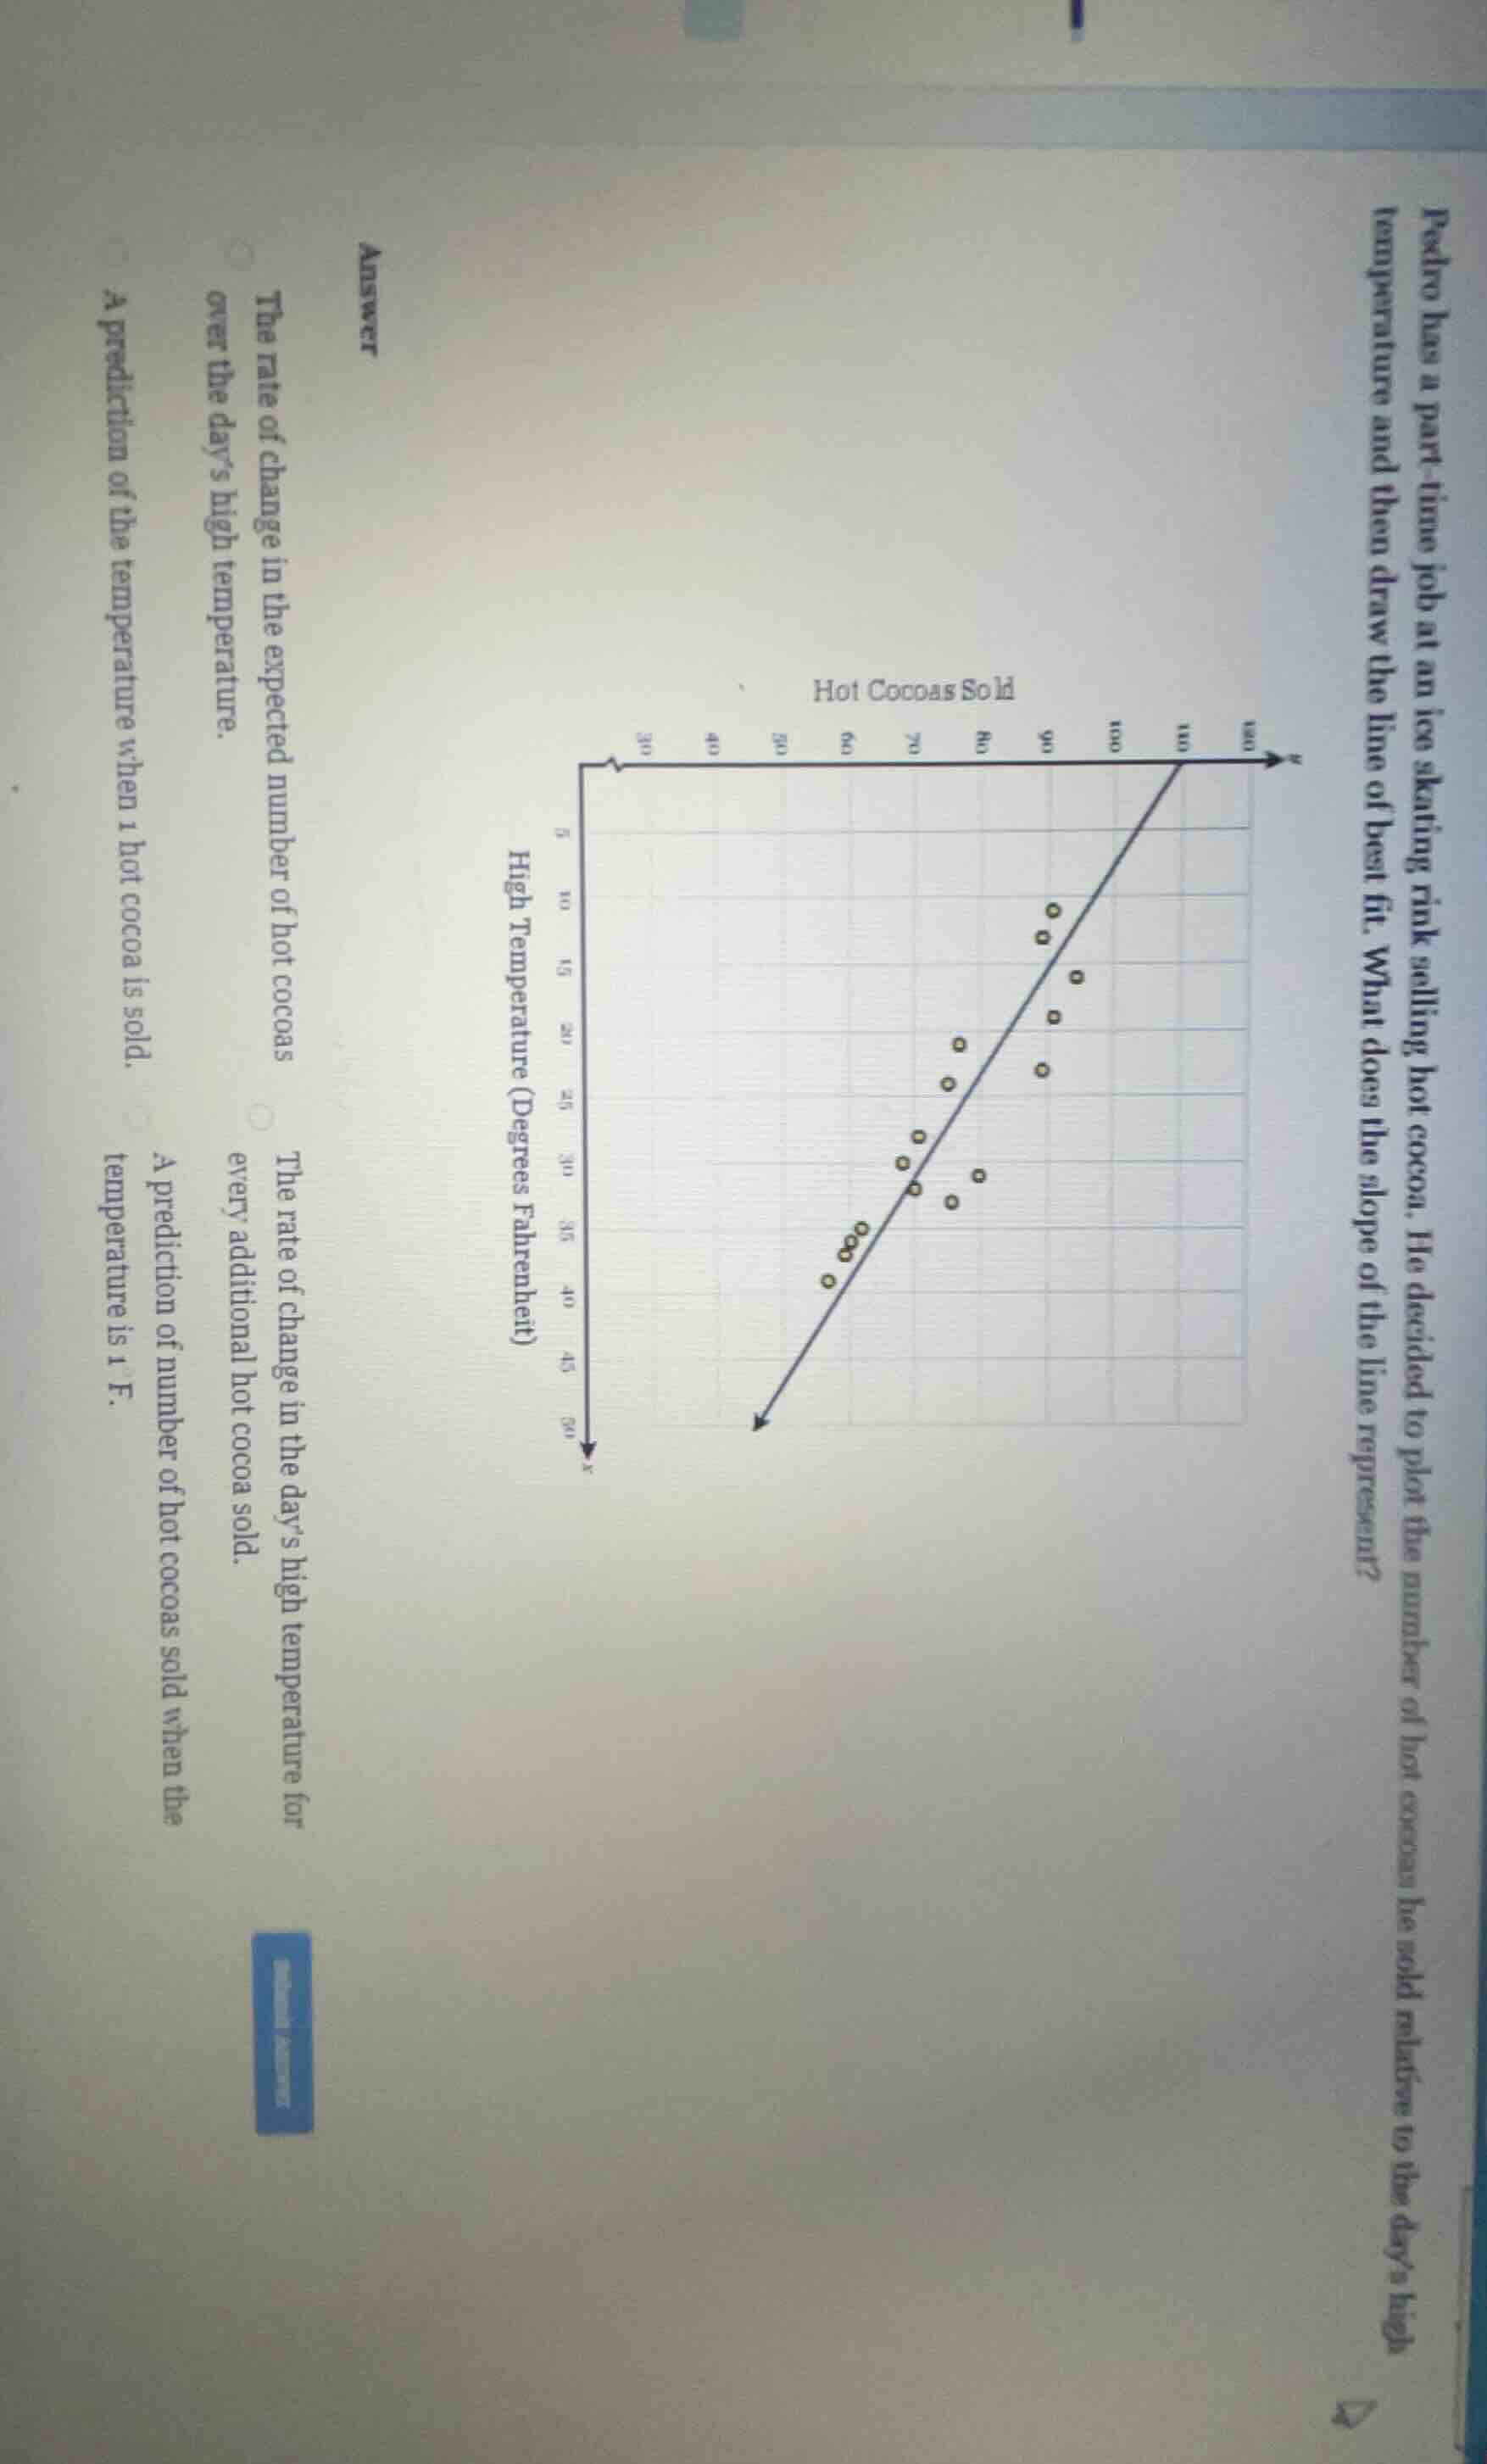
pedro has a part - time job at an ice skating rink selling hot cocoa. he decided to plot the number of hot cocoas he sold relative to the day’s high temperature and then draw the line of best fit. what does the slope of the line represent?
answer
the rate of change in the expected number of hot cocoas over the day’s high temperature.
the rate of change in the day’s high temperature for every additional hot cocoa sold.
a prediction of the temperature when 1 hot cocoa is sold.
a prediction of number of hot cocoas sold when the temperature is 1°f.
The x-axis represents the number of hot cocoas sold, and the y-axis represents high temperature. The slope of a line of best fit describes the rate of change of the y-variable relative to the x-variable. Here, it shows how the expected number of hot cocoas sold changes as the high temperature changes, or the reverse rate of change for temperature per additional cocoa sold. The correct interpretation is the rate of change in the expected number of hot cocoas over the day's high temperature.

Snap & solve any problem in the app
Get step-by-step solutions on Sovi AI
Photo-based solutions with guided steps
Explore more problems and detailed explanations
The rate of change in the expected number of hot cocoas over the day's high temperature.