QUESTION IMAGE
Question
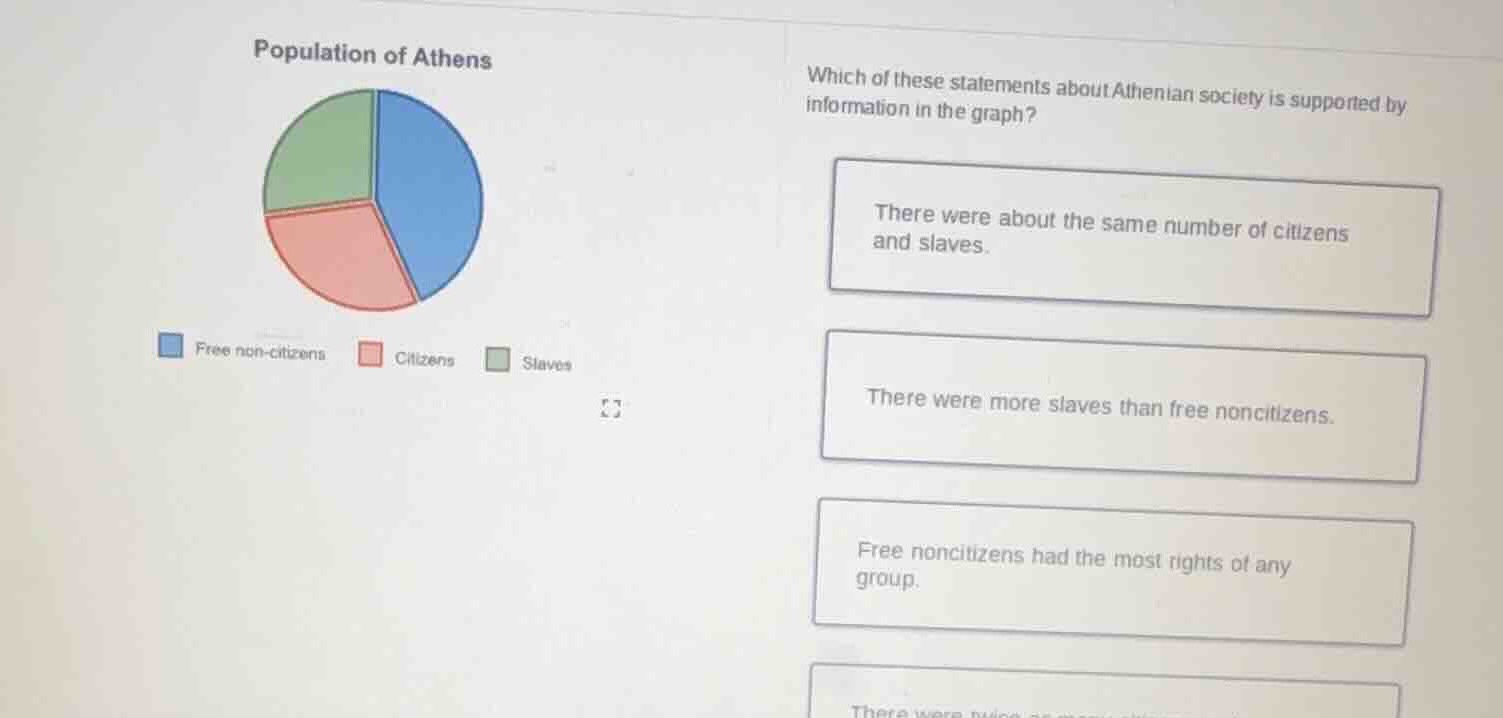
population of athens
which of these statements about athenian society is supported by information in the graph?
there were about the same number of citizens and slaves.
there were more slaves than free noncitizens.
free noncitizens had the most rights of any group.
free non - citizens: blue; citizens: red; slaves: green
To solve this, we analyze the pie chart:
- Analyze "There were about the same number of citizens and slaves":
The "Citizens" (red) and "Slaves" (green) sections look roughly equal in size. This matches the visual proportions.
- Analyze "There were more slaves than free non - citizens":
The "Free non - citizens" (blue) section is larger than the "Slaves" (green) section, so this is false.
- Analyze "Free non - citizens had the most rights of any group":
The pie chart only shows population, not rights. So we can't conclude this from the graph.
- (Assuming the last option is about quantity like "There were twice as many..."):
The "Free non - citizens" section is not twice the size of another group (e.g., citizens or slaves) based on the visual.

Snap & solve any problem in the app
Get step-by-step solutions on Sovi AI
Photo-based solutions with guided steps
Explore more problems and detailed explanations
There were about the same number of citizens and slaves.