QUESTION IMAGE
Question
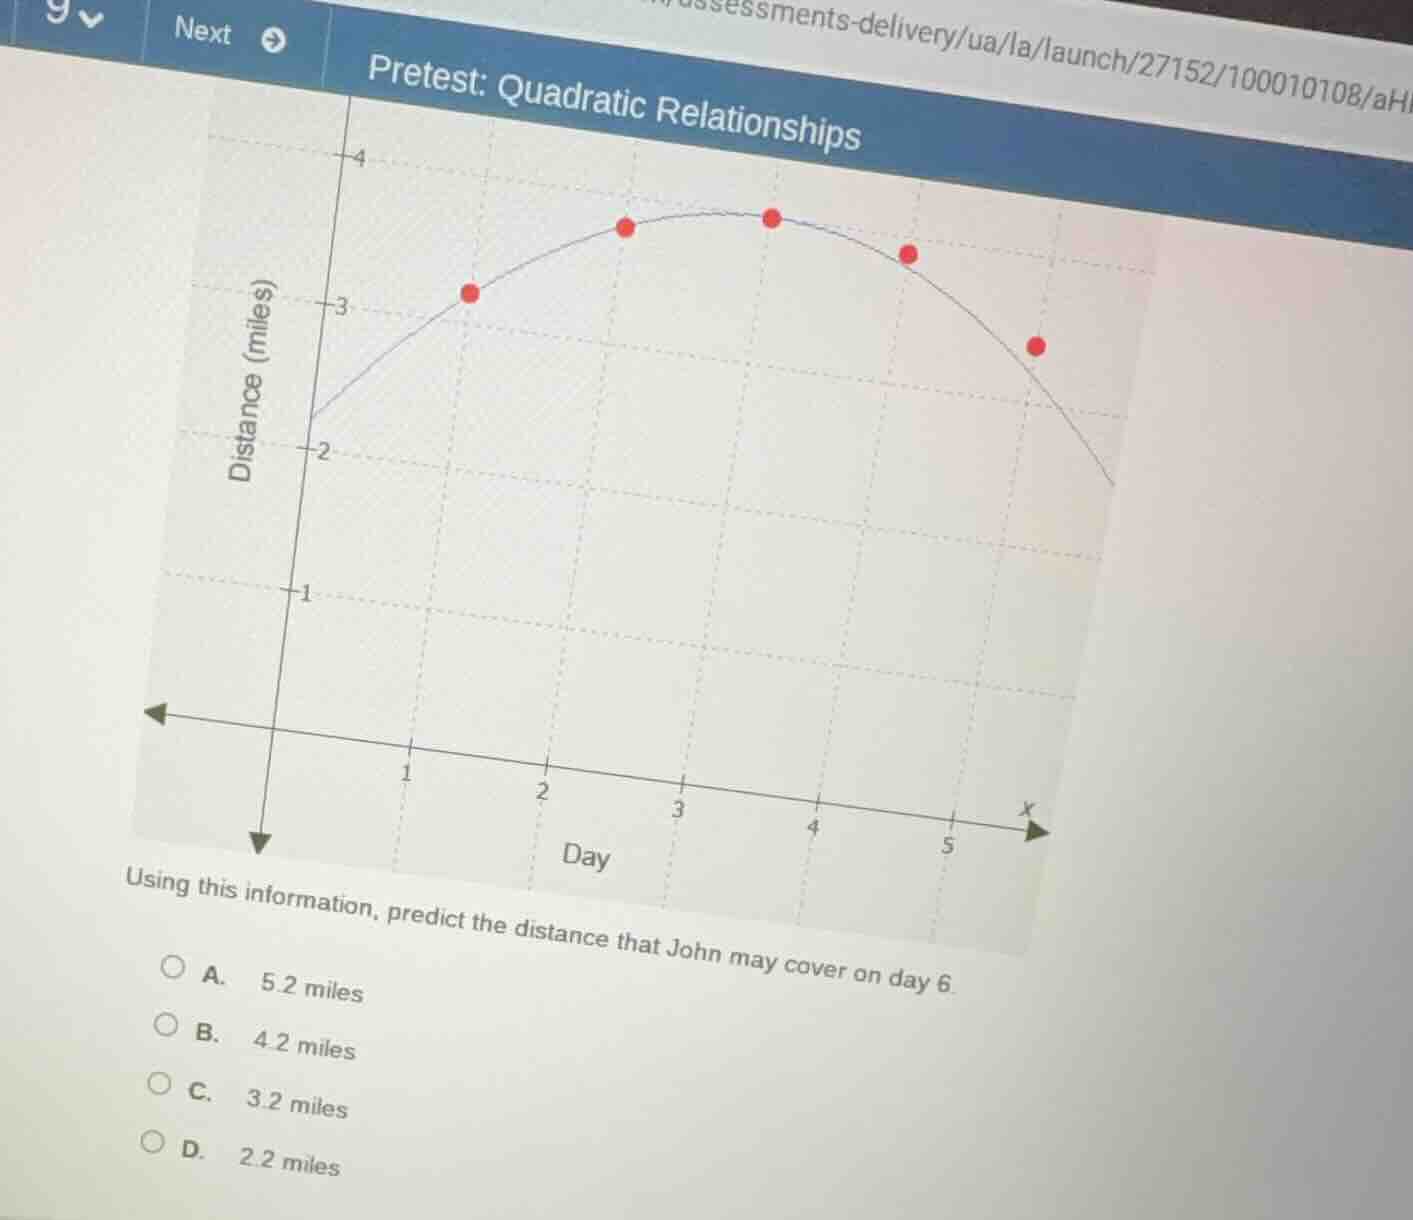
pretest: quadratic relationships
graph with x-axis labeled day and y-axis labeled distance (miles), showing a quadratic curve with red points. below the graph:
using this information, predict the distance that john may cover on day 6.
a. 5.2 miles
b. 4.2 miles
c. 3.2 miles
d. 2.2 miles
Step1: Analyze the graph trend
The graph is a quadratic curve (parabola) opening downward, so after the vertex (peak), the distance decreases as days increase. From the points, we can see the pattern of decrease. For example, from day 5 to day 6, we expect a decrease from the day 5 value (around 2.5 - 3? Wait, no, looking at the graph: day 1: 3, day 2: ~3.5, day 3: ~3.7, day 4: ~3.7, day 5: ~2.8? Wait, no, the y - axis is distance (miles). Wait, the curve is a parabola opening downward. So the symmetry: let's check the x - values. The vertex seems around x = 3 or 4? Wait, the points: at x = 1, y = 3; x = 2, y≈3.5; x = 3, y≈3.7; x = 4, y≈3.7; x = 5, y≈2.8. Wait, no, maybe the grid: each x - unit is 1 day, y - unit is 1 mile. Wait, the key is the trend after the peak. After x = 4 (or 3 - 4), the distance starts to decrease. From x = 5, the distance is, say, around 2.8 - 3? Wait, the options: D is 2.2, C is 3.2, B is 4.2, A is 5.2. Wait, the curve is decreasing after the peak. So from day 5 to day 6, we expect a decrease from day 5's distance. Let's see the pattern: from day 1 (3) to day 2 (≈3.5) to day 3 (≈3.6) to day 4 (≈3.6) to day 5 (≈2.8? No, maybe my misreading. Wait, the red dots: at x = 1, y = 3; x = 2, y = 3.5; x = 3, y = 3.7; x = 4, y = 3.7; x = 5, y = 2.8? No, that can't be. Wait, maybe the y - axis: the first red dot at x = 1, y = 3; x = 2, y = 3.5; x = 3, y = 3.7; x = 4, y = 3.7; x = 5, y = 2.8? No, the curve is a parabola, so symmetric. The axis of symmetry is around x = 3.5 (midpoint of x = 3 and x = 4, since y is same at x = 3 and x = 4). So the distance at x = 1 should be equal to x = 6 (by symmetry, if axis is x = 3.5, then x = 1 and x = 6 are symmetric around x = 3.5 (since 3.5 - 1 = 2.5, 6 - 3.5 = 2.5)). Wait, at x = 1, y = 3. So at x = 6, y should be equal to x = 1? But no, the curve is not symmetric in the decreasing part? Wait, no, a parabola is symmetric about its axis. So if the axis is x = h, then f(h + a)=f(h - a). So if h = 3.5, then f(3.5 + a)=f(3.5 - a). So f(1)=f(6) (since 3.5 - 2.5 = 1, 3.5+2.5 = 6). At x = 1, y = 3. But the options have 2.2, 3.2, etc. Wait, maybe my initial analysis is wrong. Wait, the graph: the y - intercept is around 2.3 - 2.5. Then at x = 1, y = 3; x = 2, y = 3.5; x = 3, y = 3.7; x = 4, y = 3.7; x = 5, y = 2.8. Wait, no, the curve is a downward - opening parabola, so the function is y = -ax²+bx + c. The key is the trend: after the peak (around x = 3 - 4), the distance decreases. So from x = 5 to x = 6, we expect a decrease. Let's see the rate of decrease. From x = 4 to x = 5: if at x = 4, y≈3.7, at x = 5, y≈2.8 (decrease of 0.9). From x = 5 to x = 6, maybe a decrease of around 0.6, so 2.8 - 0.6 = 2.2? Wait, option D is 2.2. Alternatively, if we consider the symmetry: the distance at x = 1 is 3, at x = 6 (since the axis of symmetry is, say, x = 3.5, then x = 1 and x = 6 are symmetric? 3.5 - 1 = 2.5, 6 - 3.5 = 2.5. So y(1)=y(6)? But y(1)=3, but option C is 3.2, D is 2.2. Wait, maybe my symmetry is wrong. Wait, the graph's y - intercept is around 2.3. So the function is a quadratic, so y = -ax²+bx + c. Let's assume the vertex is at x = 3, y = 4 (approx). Then the equation: y = -a(x - 3)²+4. At x = 1, y = 3: 3=-a(1 - 3)²+4→3=-4a + 4→4a = 1→a = 0.25. So y=-0.25(x - 3)²+4. At x = 5: y=-0.25(2)²+4=-1 + 4 = 3? Wait, no, that's not matching. Wait, maybe the vertex is at x = 3.5, y = 3.75. Then y=-a(x - 3.5)²+3.75. At x = 1: y=-a(2.5)²+3.75 = 3→-6.25a=3 - 3.75=-0.75→a = 0.75/6.25 = 0.12. Then at x = 5: y=-0.12(1.5)²+3.75=-0.12*2.25 + 3.75=-0.27+3.75 = 3.48. At x = 6: y=-0.12(2.5)²+3.75=-0.1…

Snap & solve any problem in the app
Get step-by-step solutions on Sovi AI
Photo-based solutions with guided steps
Explore more problems and detailed explanations
D. 2.2 miles