QUESTION IMAGE
Question
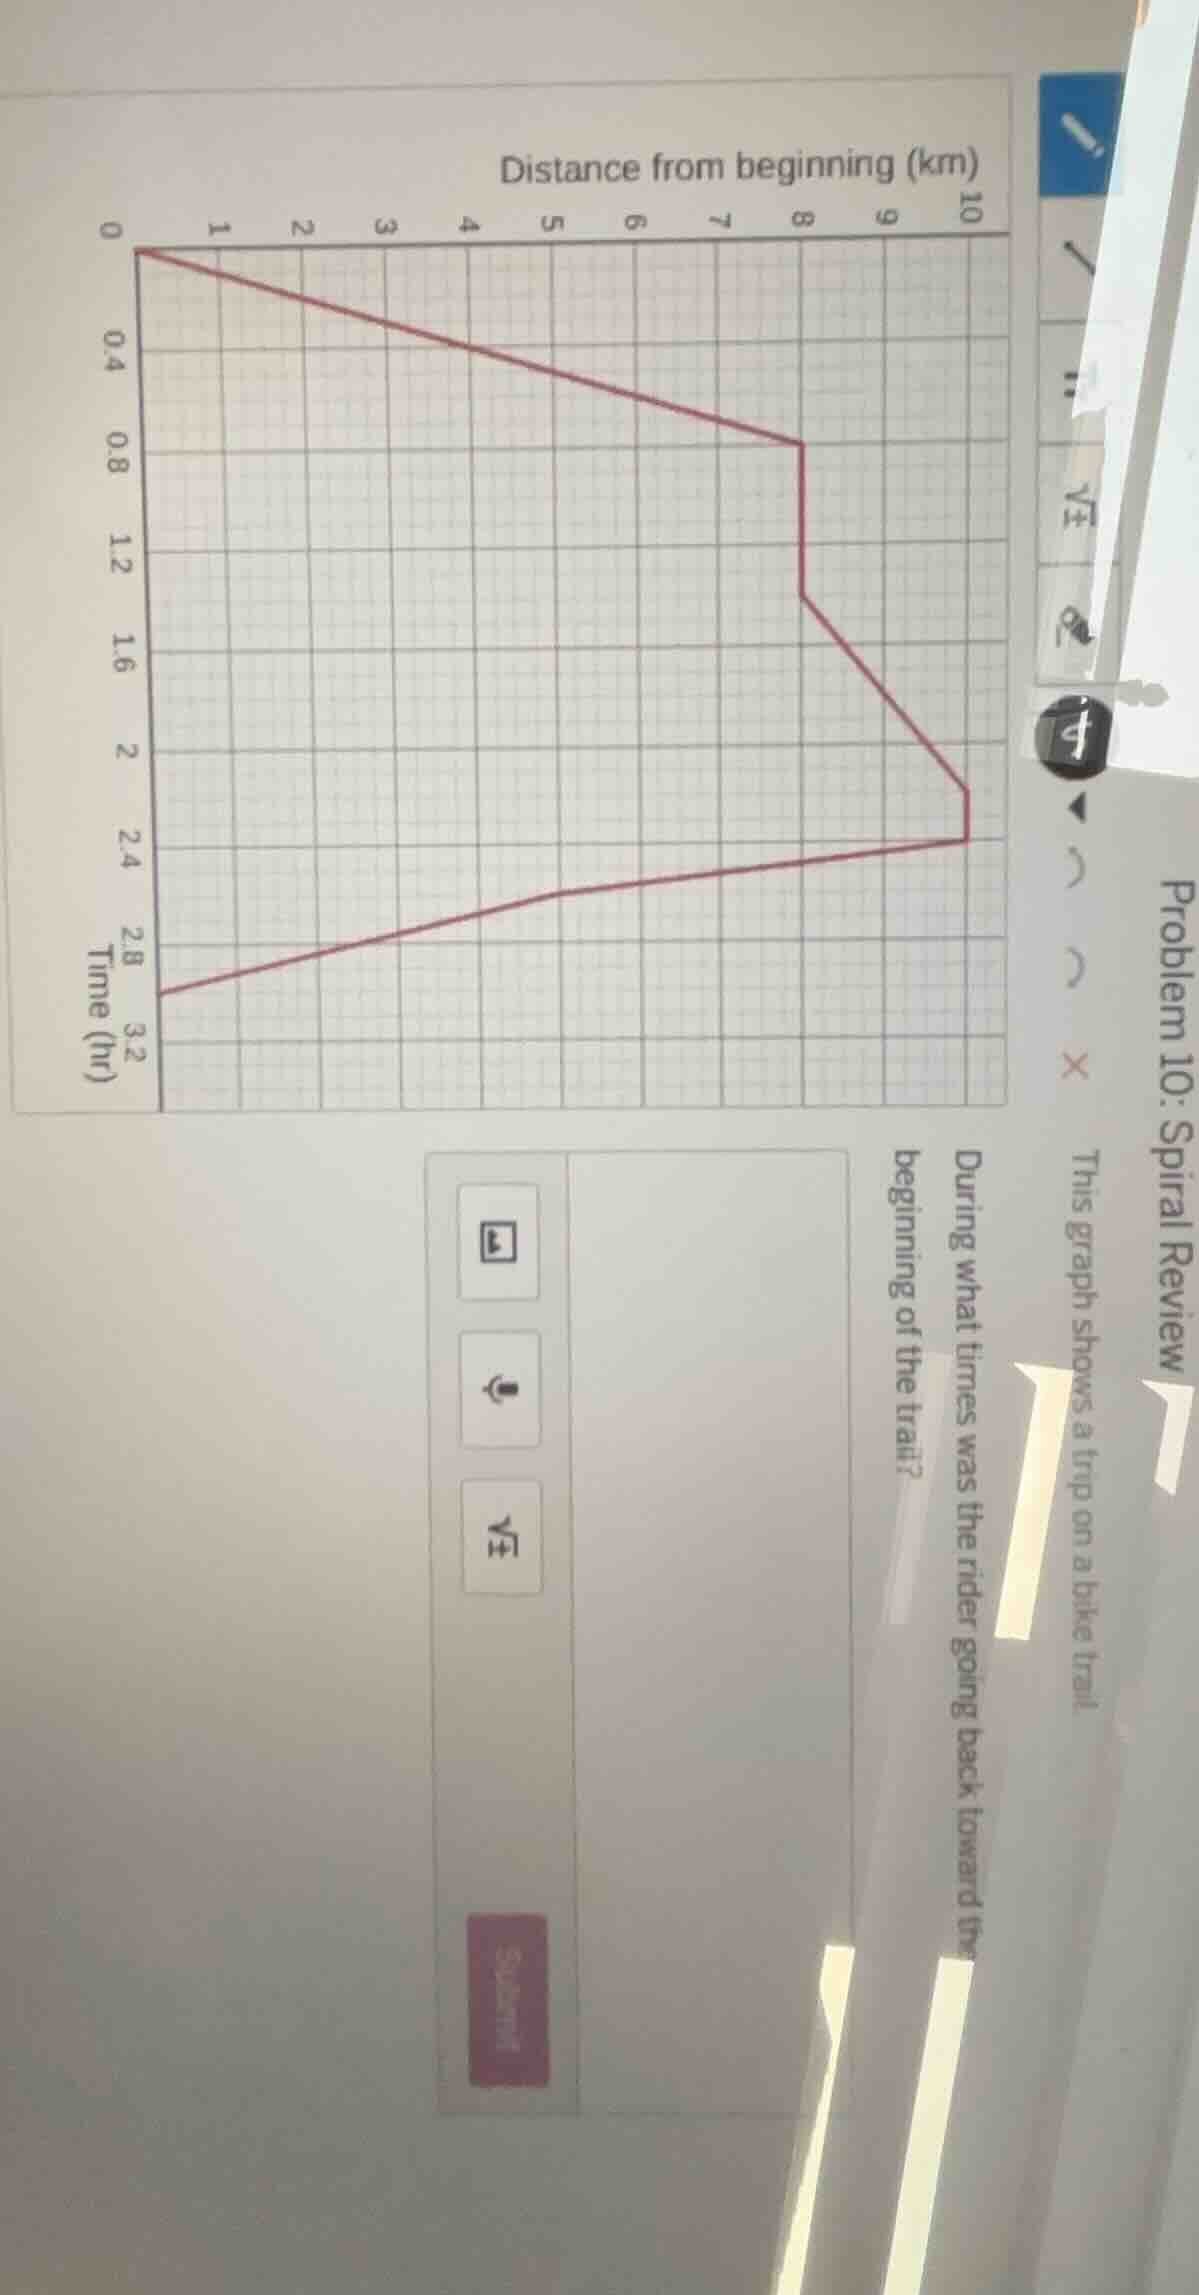
problem 10: spiral review this graph shows a trip on a bike trail during what times was the rider going back toward the beginning of the trail?
To determine when the rider is going back toward the beginning of the trail, we analyze the distance - time graph. When the rider is moving back toward the start, the distance from the beginning should be decreasing as time increases. Looking at the graph, we identify the intervals where the distance from the beginning (on the y - axis, wait, actually the x - axis is distance from beginning (km) and the y - axis is time (hr)) is decreasing with respect to time. Wait, actually, in a distance - time graph, if we consider the x - axis as distance from the start (km) and the y - axis as time (hr), a decreasing distance with increasing time (a negative slope of the distance - time line) indicates movement back toward the start. From the graph, we can see that in the interval from \(t = 0\) to \(t\approx0.8\) hours (or looking at the x - axis (distance) and y - axis (time), when the line is going from \(x = 0\) (start) to lower \(x\) values as \(y\) (time) increases? Wait, no, let's re - interpret the axes. The x - axis is "Distance from beginning (km)" and the y - axis is "Time (hr)". So a point \((x,y)\) means at time \(y\) hours, the distance from the beginning is \(x\) km. So when the rider is going back toward the beginning, the distance \(x\) should decrease as time \(y\) increases. So we look for the part of the graph where as \(y\) (time) increases, \(x\) (distance from start) decreases. From the graph, we can see that in the interval from \(t = 0\) to \(t\approx0.8\) hours (the first segment of the graph) and then another segment? Wait, no, let's look at the graph again. The first part of the graph (from time 0 to around time 0.8 hours) has a negative slope (distance from start decreases as time increases), then there are other segments. Wait, maybe the correct interval is from \(t = 0\) to \(t\approx0.8\) hours (or more accurately, from time 0 to the time when the distance from start starts to increase again). But from the visual, the first part of the graph (the left - most segment) shows that as time increases, the distance from the start decreases, which means the rider is moving back toward the beginning. Also, another segment: from around \(t = 0.8\) to \(t\approx1.6\) hours? Wait, no, maybe I got the axes reversed. Wait, maybe the x - axis is time and the y - axis is distance? No, the label says "Distance from beginning (km)" on the x - axis and "Time (hr)" on the y - axis. Let's assume that the correct interpretation is that when the line is going from a higher distance (on the x - axis) to a lower distance (on the x - axis) as time (y - axis) increases, that's movement back. So from the graph, the first segment (from time 0 to time \(t_1\)) has a negative slope (distance from start decreases with time), then a vertical segment (distance from start is constant, so stopped), then another decreasing segment? Wait, maybe the intended answer is from \(t = 0\) to \(t\approx0.8\) hours (or the interval where the distance from the start is decreasing with time). But maybe a more accurate way: looking at the graph, the rider is going back toward the beginning when the distance from the beginning (x - axis) decreases as time (y - axis) increases. So the first part of the graph (from \(y = 0\) to \(y\approx0.8\) hours) and maybe another part. But typically, from the graph, the interval when the rider is going back toward the beginning is from \(t = 0\) to \(t\approx0.8\) hours (or the time when the distance from start is decreasing). But maybe the answer is from \(0\) to \(0.8\) hours (or more precisely, from time 0 to the time corr…

Snap & solve any problem in the app
Get step-by-step solutions on Sovi AI
Photo-based solutions with guided steps
Explore more problems and detailed explanations
The rider is going back toward the beginning of the trail from \(t = 0\) hours to \(t\approx0.8\) hours (or the interval where the distance from the start decreases with increasing time, which can be visually identified from the graph as the first segment and possibly another segment, but the main decreasing - distance - with - time segment is from \(0\) to around \(0.8\) hours).