QUESTION IMAGE
Question
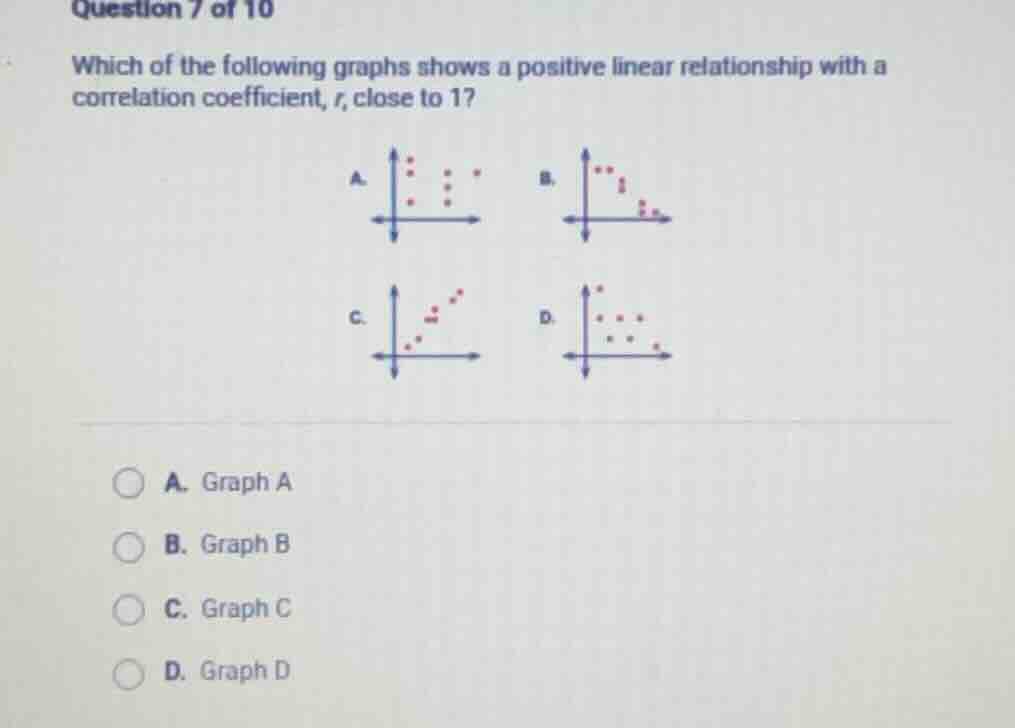
question 7 of 10
which of the following graphs shows a positive linear relationship with a correlation coefficient, $r$, close to 1?
a. graph a
b. graph b
c. graph c
d. graph d
A positive linear relationship means as the x-value increases, the y-value also increases. A correlation coefficient close to 1 indicates the data points are tightly clustered along an upward-sloping straight line. Graph A has scattered points with no clear upward trend. Graph B shows a negative downward trend. Graph D has scattered points with a weak downward trend. Only Graph C has points that follow a clear upward, tight linear pattern.

Snap & solve any problem in the app
Get step-by-step solutions on Sovi AI
Photo-based solutions with guided steps
Explore more problems and detailed explanations
C. Graph C