QUESTION IMAGE
Question
question #14
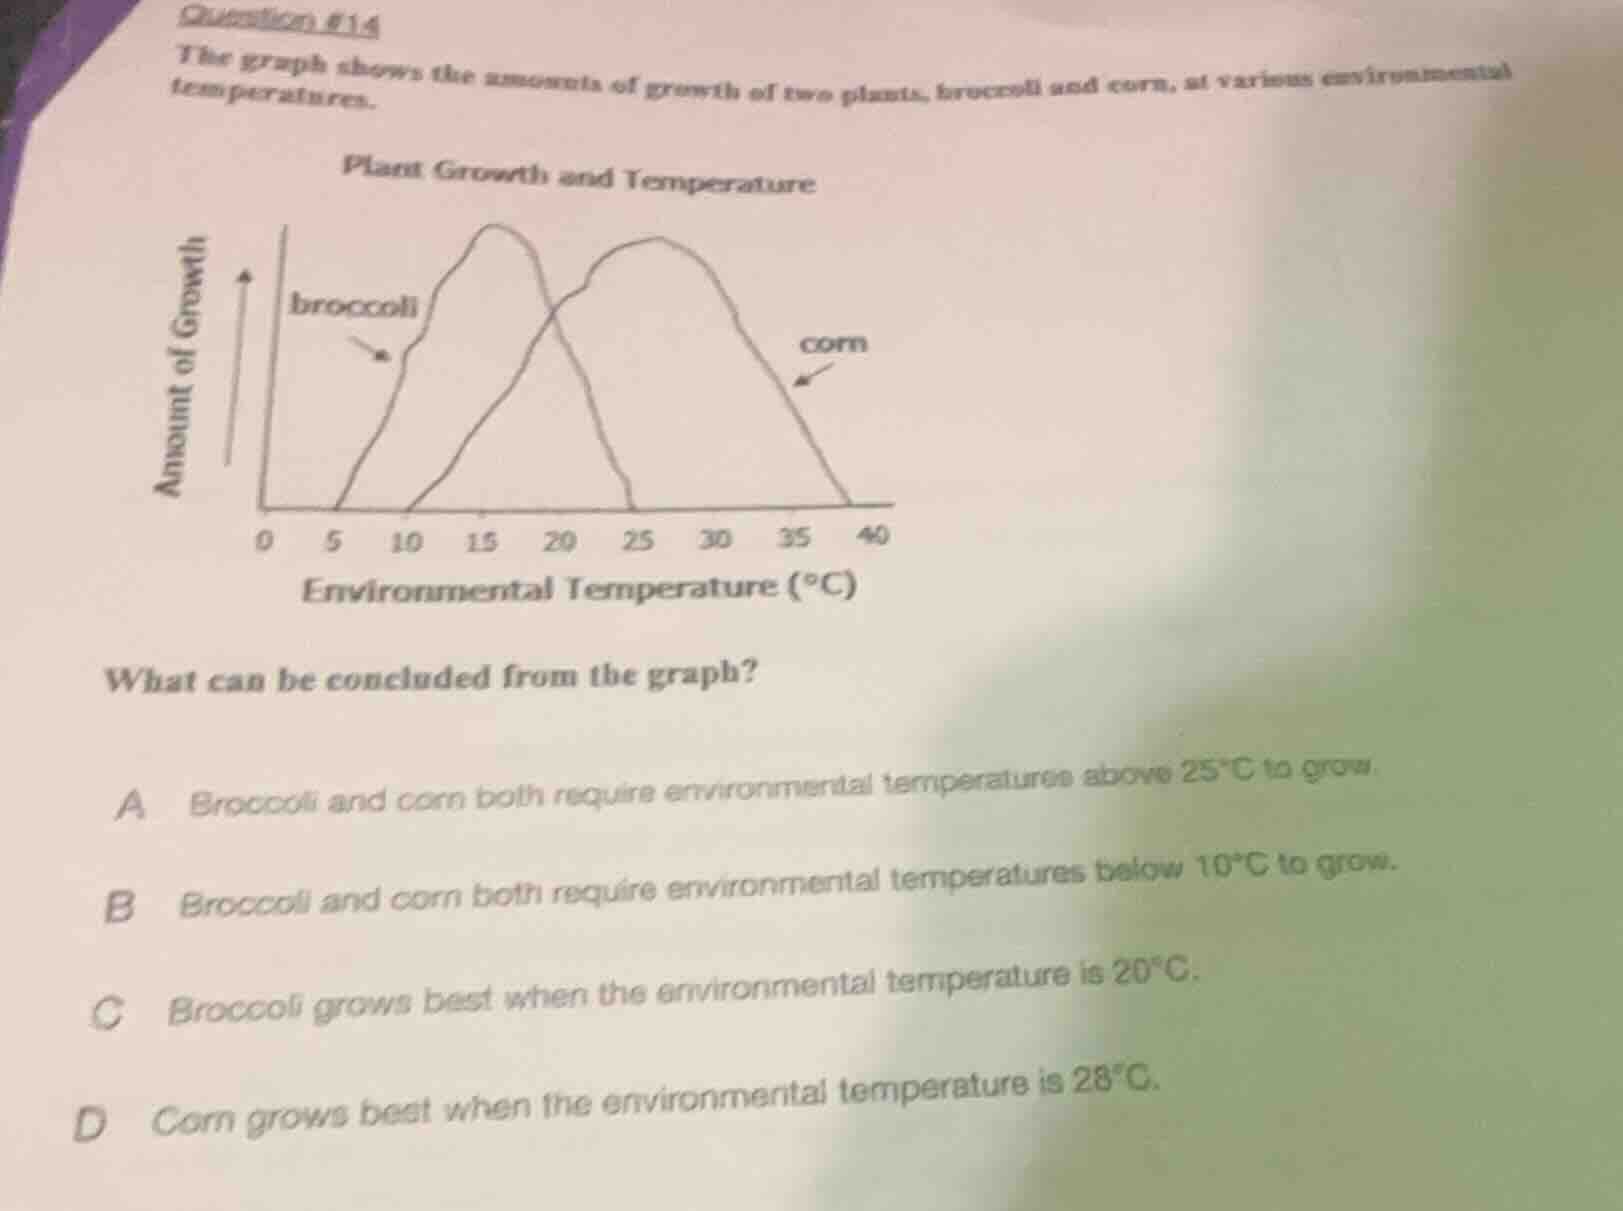
the graph shows the amounts of growth of two plants, broccoli and corn, at various environmental temperatures.
plant growth and temperature
what can be concluded from the graph?
a broccoli and corn both require environmental temperatures above 25°c to grow.
b broccoli and corn both require environmental temperatures below 10°c to grow.
c broccoli grows best when the environmental temperature is 20°c.
d corn grows best when the environmental temperature is 28°c.
- Option A: Broccoli's growth declines above 25°C (its curve drops after 25°C), so it does not require above 25°C to grow. Eliminate A.
- Option B: Both plants start growing around 5 - 10°C (their curves start rising after ~5 - 10°C), not below 10°C. Eliminate B.
- Option C: Broccoli's peak (best growth) is around 15 - 20°C? Wait, no, the graph shows broccoli's curve peaks before 20, maybe around 15 - 20? Wait, no, let's recheck. Wait, the corn's curve peaks around 30? Wait, no, the question's options: C says broccoli grows best at 20°C. Wait, maybe I misread. Wait, the broccoli curve: when does it peak? The graph's x-axis is 0 - 40. Broccoli's curve: starts at 5, rises to a peak around 15 - 20? Wait, no, the corn's curve starts at 10, rises to peak around 30? Wait, no, the option D: corn grows best at 28°C. Let's analyze each option:
A: Both need above 25°C. But broccoli's growth stops (curve ends) around 25°C, while corn continues to 40. So broccoli doesn't need above 25. Eliminate A.
B: Both need below 10°C. But broccoli starts growing at 5, corn at 10. So below 10, corn doesn't grow. Eliminate B.
C: Broccoli grows best at 20°C. Wait, broccoli's peak: looking at the graph, broccoli's curve peaks before 20? Or around 20? Wait, maybe the graph's broccoli curve peaks at ~15 - 20, but corn's at ~30. Wait, option D: corn grows best at 28°C. Let's see: corn's curve peaks around 30, so 28 is close. Now, check C: broccoli's peak—if the broccoli curve peaks at ~15 - 20, but maybe the graph shows broccoli's best growth at 15 - 20, but option C says 20. Wait, maybe I made a mistake. Wait, let's re-express:
The graph shows:
- Broccoli: growth starts at ~5°C, peaks around 15 - 20°C, then declines, ending at ~25°C.
- Corn: growth starts at ~10°C, peaks around 30°C, ends at ~40°C.
Now, option C: Broccoli grows best at 20°C. Is 20°C near its peak? Maybe. But option D: Corn grows best at 28°C. Corn's peak is around 30, so 28 is close. Now, let's check the options again:
C: Broccoli's best at 20°C. Let's see, if broccoli's peak is at 15 - 20, then 20 is plausible. But D: Corn's best at 28°C. Corn's peak is around 30, so 28 is close. Wait, maybe I misread the graph. Wait, the original graph: "Plant Growth and Temperature" with broccoli and corn. Let's assume the broccoli curve peaks at ~15 - 20, corn at ~30.
Now, let's check each option:
A: Both need above 25°C. No, broccoli stops at 25. Eliminate.
B: Both need below 10°C. No, corn starts at 10. Eliminate.
C: Broccoli best at 20°C. If broccoli's peak is at 20, then C could be correct? Wait, but maybe the graph shows broccoli's peak at 15, and corn's at 30. Wait, maybe the answer is D. Wait, let's think again.
Wait, the key is to find which conclusion is correct. Let's analyze each option:
A: Incorrect, as broccoli's growth is highest below 25°C, and it stops growing around 25°C.
B: Incorrect, as both plants start growing above 5°C (broccoli) and 10°C (corn), so they don't require below 10°C.
C: Broccoli's best growth—does the graph show its peak at 20°C? Let's see, the broccoli curve: when x=20, is that the peak? Maybe. But corn's curve: at x=28, is that near its peak (which is around 30)? So D: corn grows best at 28°C. Which is more accurate?
Wait, maybe the graph's corn curve peaks at 30°C, so 28 is close. So D is correct. Let's confirm:
- A: Wrong, broccoli doesn't need above 25.
- B: Wrong, corn starts at 10, so below 10 it doesn't grow.
- C: Broccoli's peak—maybe the graph shows broccoli's peak at 15 - 20, but 20 is the option. Wait, but maybe the graph's broccoli peak is at…

Snap & solve any problem in the app
Get step-by-step solutions on Sovi AI
Photo-based solutions with guided steps
Explore more problems and detailed explanations
D. Corn grows best when the environmental temperature is 28°C.