QUESTION IMAGE
Question
question 2 a20402_003a
customers
6
4
√ select choice
0.4
0.1
0.5
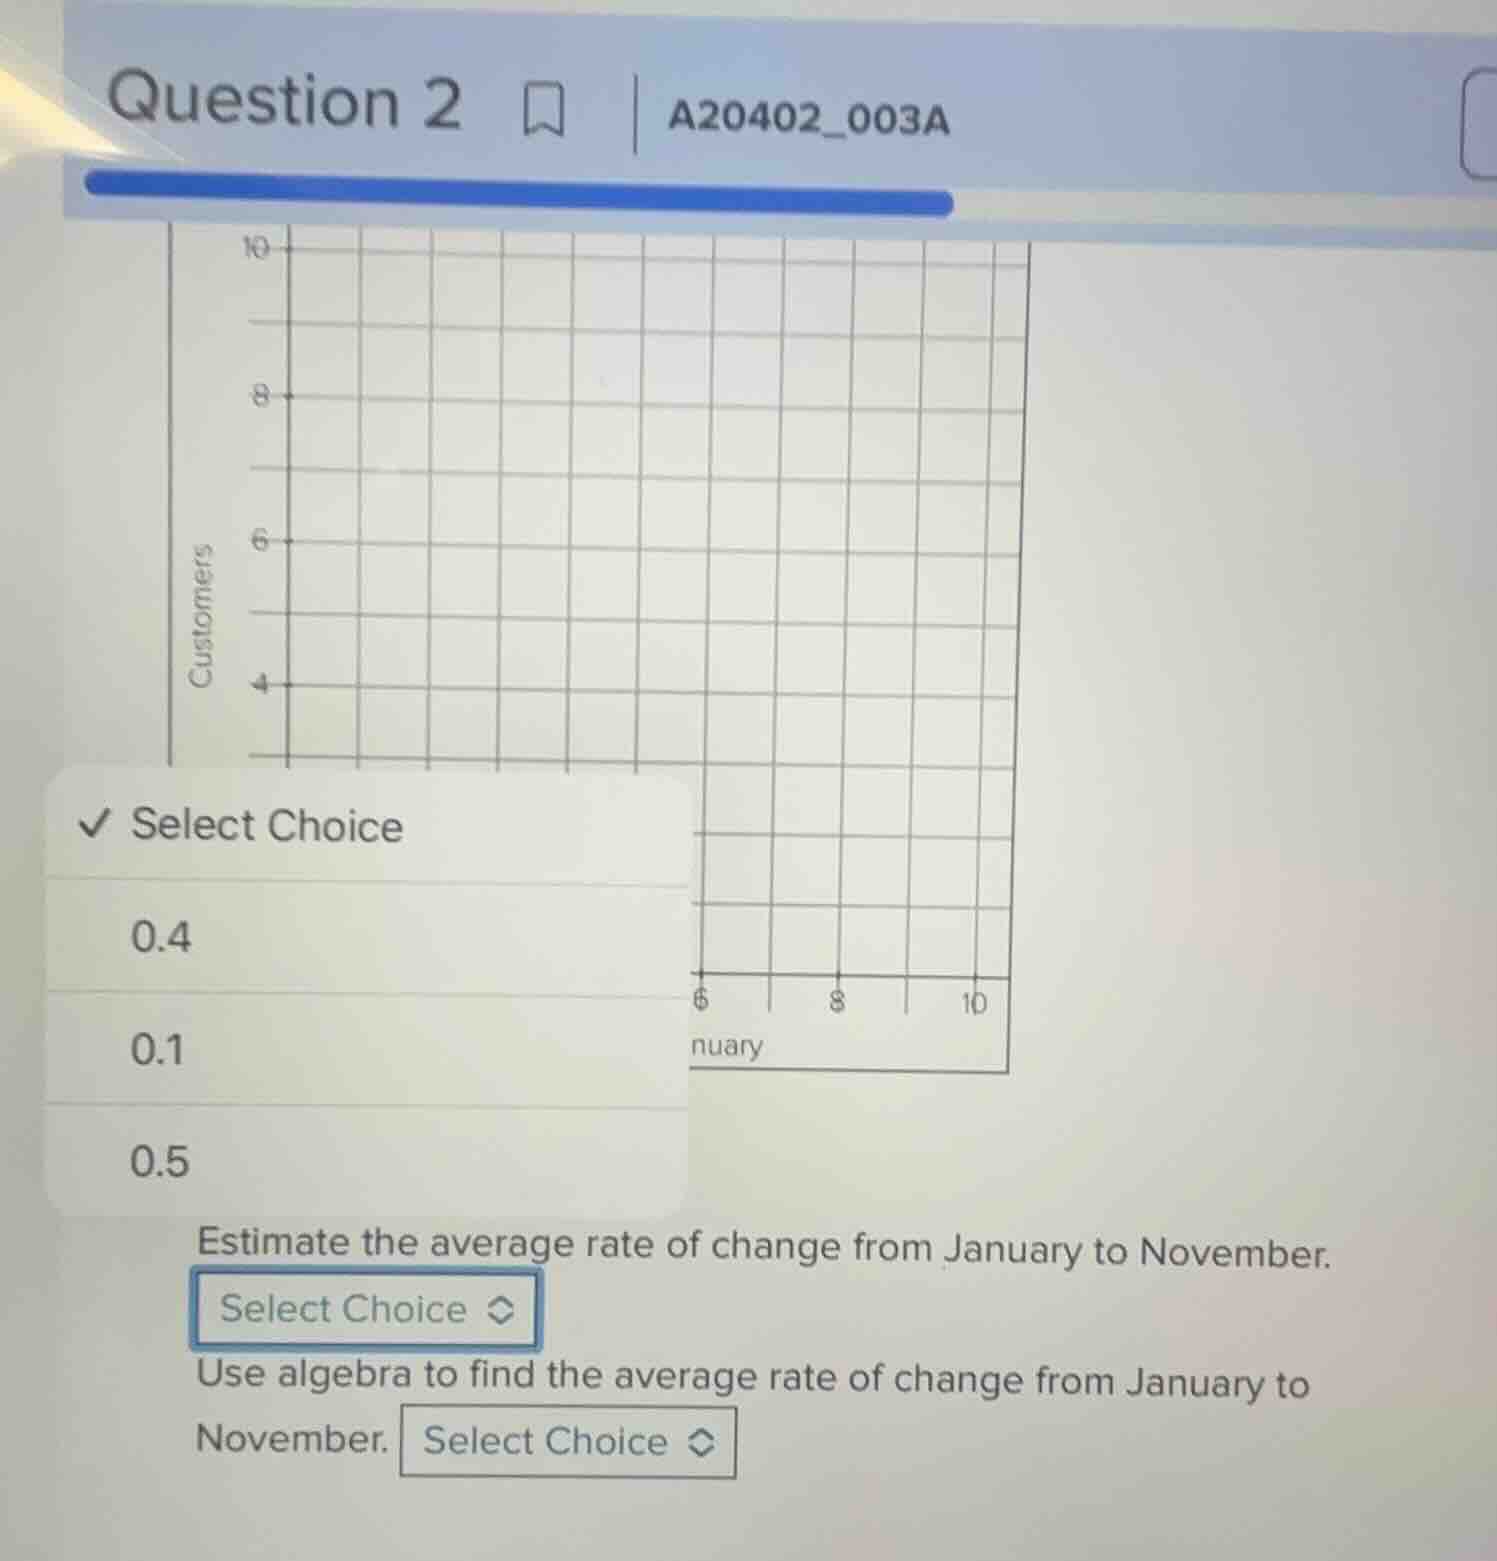
estimate the average rate of change from january to november.
select choice
use algebra to find the average rate of change from january to
november. select choice
6 8 10
nuary
Step1: Identify the coordinates
From the graph, assume January is at \( x = 6 \) (month 6) with \( y = 4 \) customers, and November is at \( x = 10 \) (month 10) with \( y = 8 \) customers.
Step2: Apply average rate of change formula
The formula for average rate of change is \( \frac{\Delta y}{\Delta x}=\frac{y_2 - y_1}{x_2 - x_1} \).
Substitute \( y_2 = 8 \), \( y_1 = 4 \), \( x_2 = 10 \), \( x_1 = 6 \):
\( \frac{8 - 4}{10 - 6}=\frac{4}{4} = 1 \)? Wait, maybe the graph has different values. Wait, maybe January is \( x = 1 \) (month 1) with \( y = 4 \), November is \( x = 11 \) (month 11)? Wait, the x - axis labels: "nuary" (January) at 6? Maybe the x - axis is months from 6 to 10, so January is month 6, November is month 10 (10 months later? No, January to November is 10 months? Wait, January is month 1, November is month 11. Maybe the graph has x - axis as month number, with January at \( x = 1 \), November at \( x = 11 \), and y - axis customers. But from the grid, at \( x = 6 \) (January?) \( y = 4 \), at \( x = 10 \) (November?) \( y = 8 \). Then \( \Delta x=10 - 6 = 4 \), \( \Delta y = 8 - 4 = 4 \), so \( \frac{4}{4}=1 \). But the options are 0.4, 0.1, 0.5. Wait, maybe I misread. Wait, maybe January is \( x = 0 \), November is \( x = 10 \) (10 months), and \( y_1 = 4 \), \( y_2 = 8 \). Then \( \frac{8 - 4}{10 - 0}=0.4 \). Ah, that makes sense. So \( x_1 = 0 \) (January), \( x_2 = 10 \) (November), \( y_1 = 4 \), \( y_2 = 8 \). Then \( \frac{8 - 4}{10 - 0}=\frac{4}{10}=0.4 \).

Snap & solve any problem in the app
Get step-by-step solutions on Sovi AI
Photo-based solutions with guided steps
Explore more problems and detailed explanations
0.4