QUESTION IMAGE
Question
question
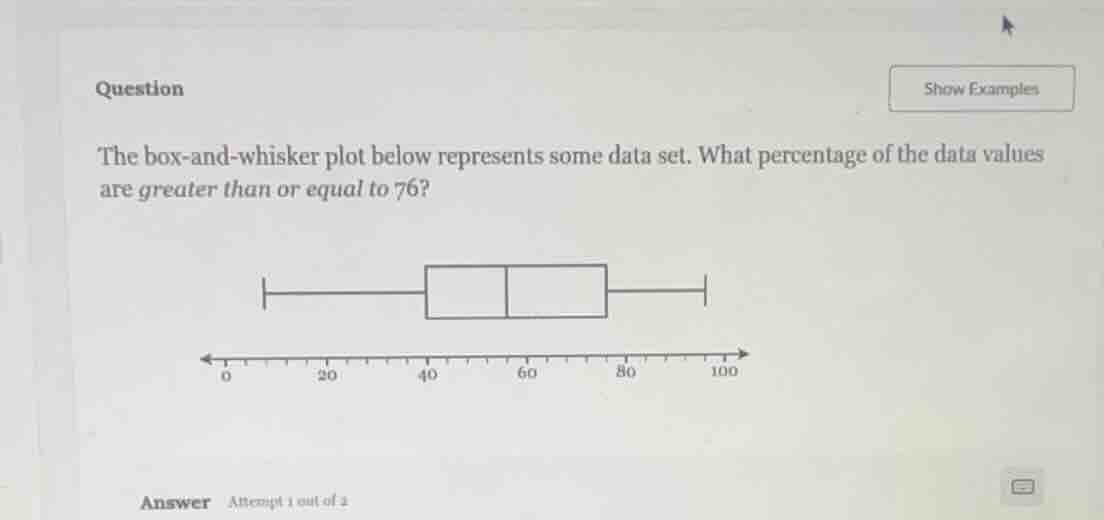
the box-and-whisker plot below represents some data set. what percentage of the data values are greater than or equal to 76?
answer attempt 1 out of 2
Step1: Identify key box plot values
The box plot's median (middle line) is 60, third quartile (right box edge) is 76, maximum is 100.
Step2: Interpret quartile percentage
In a box plot, the third quartile ($Q_3$) marks the value where 75% of data is below it, so $100\% - 75\% = 25\%$ of data is at or above $Q_3$.

Snap & solve any problem in the app
Get step-by-step solutions on Sovi AI
Photo-based solutions with guided steps
Explore more problems and detailed explanations
25%