QUESTION IMAGE
Question
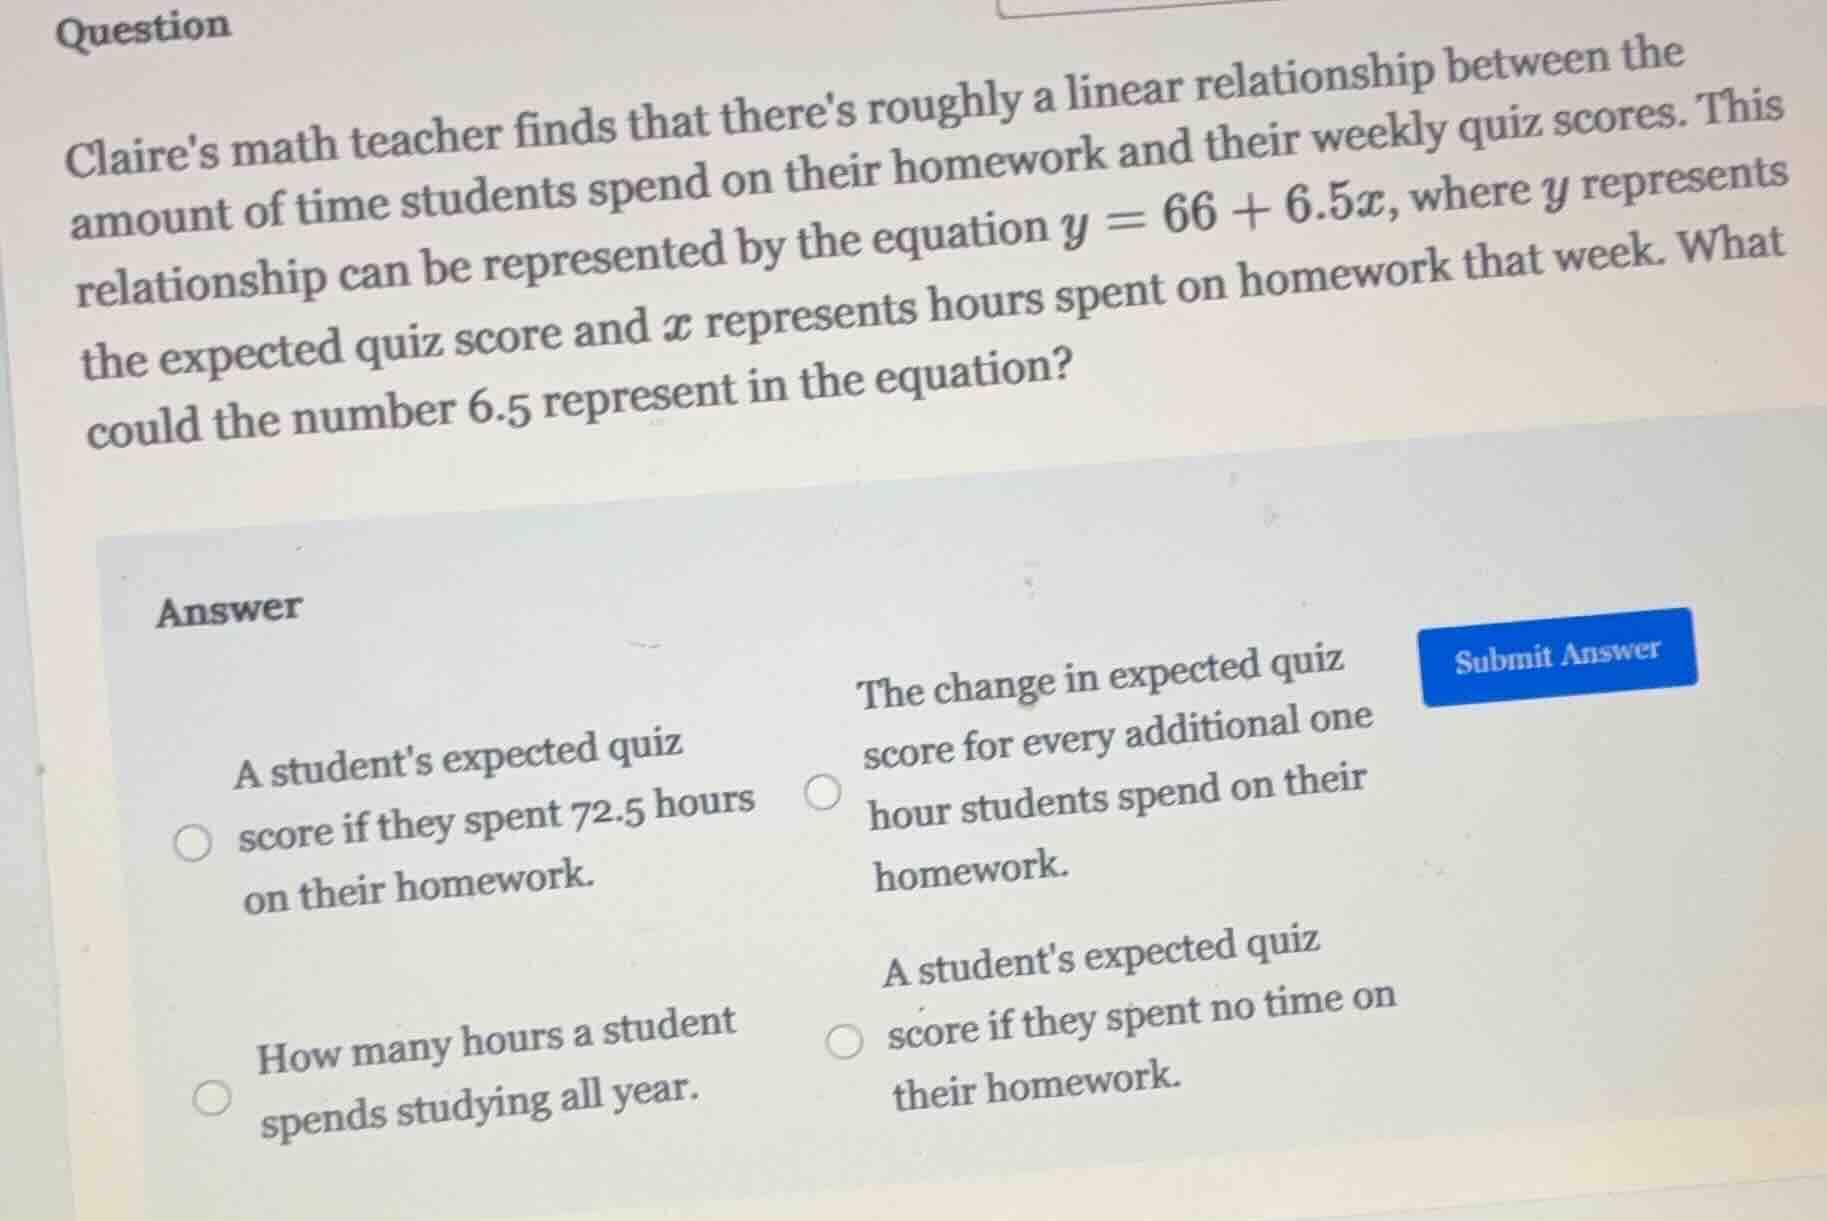
question claires math teacher finds that theres roughly a linear relationship between the amount of time students spend on their homework and their weekly quiz scores. this relationship can be represented by the equation $y = 66 + 6.5x$, where $y$ represents the expected quiz score and $x$ represents hours spent on homework that week. what could the number 6.5 represent in the equation? answer a students expected quiz score if they spent 72.5 hours on their homework. how many hours a student spends studying all year. the change in expected quiz score for every additional one hour students spend on their homework. a students expected quiz score if they spent no time on their homework.
The equation \( y = 66 + 6.5x \) is in slope - intercept form (\( y=mx + b \)), where \( m \) is the slope. The slope represents the rate of change. Here, \( x \) is the hours spent on homework and \( y \) is the quiz score. The value \( 6.5 \) (the coefficient of \( x \)) represents the change in \( y \) (quiz score) for a unit change in \( x \) (hours of homework).
- The first option is incorrect because to find the score for 72.5 hours, we would calculate \( y = 66+6.5\times72.5 \), and 6.5 is not this score.
- The third option is incorrect as 6.5 has nothing to do with the total study hours in a year.
- The fourth option is incorrect because the score when \( x = 0 \) (no homework) is 66 (the \( y \) - intercept), not 6.5.
- The second option correctly describes the slope: the change in expected quiz score for every additional one hour students spend on their homework.

Snap & solve any problem in the app
Get step-by-step solutions on Sovi AI
Photo-based solutions with guided steps
Explore more problems and detailed explanations
The change in expected quiz score for every additional one hour students spend on their homework.