QUESTION IMAGE
Question
question 2
score on last try: 0 of 30 pts. see details for more.
you can retry this question below
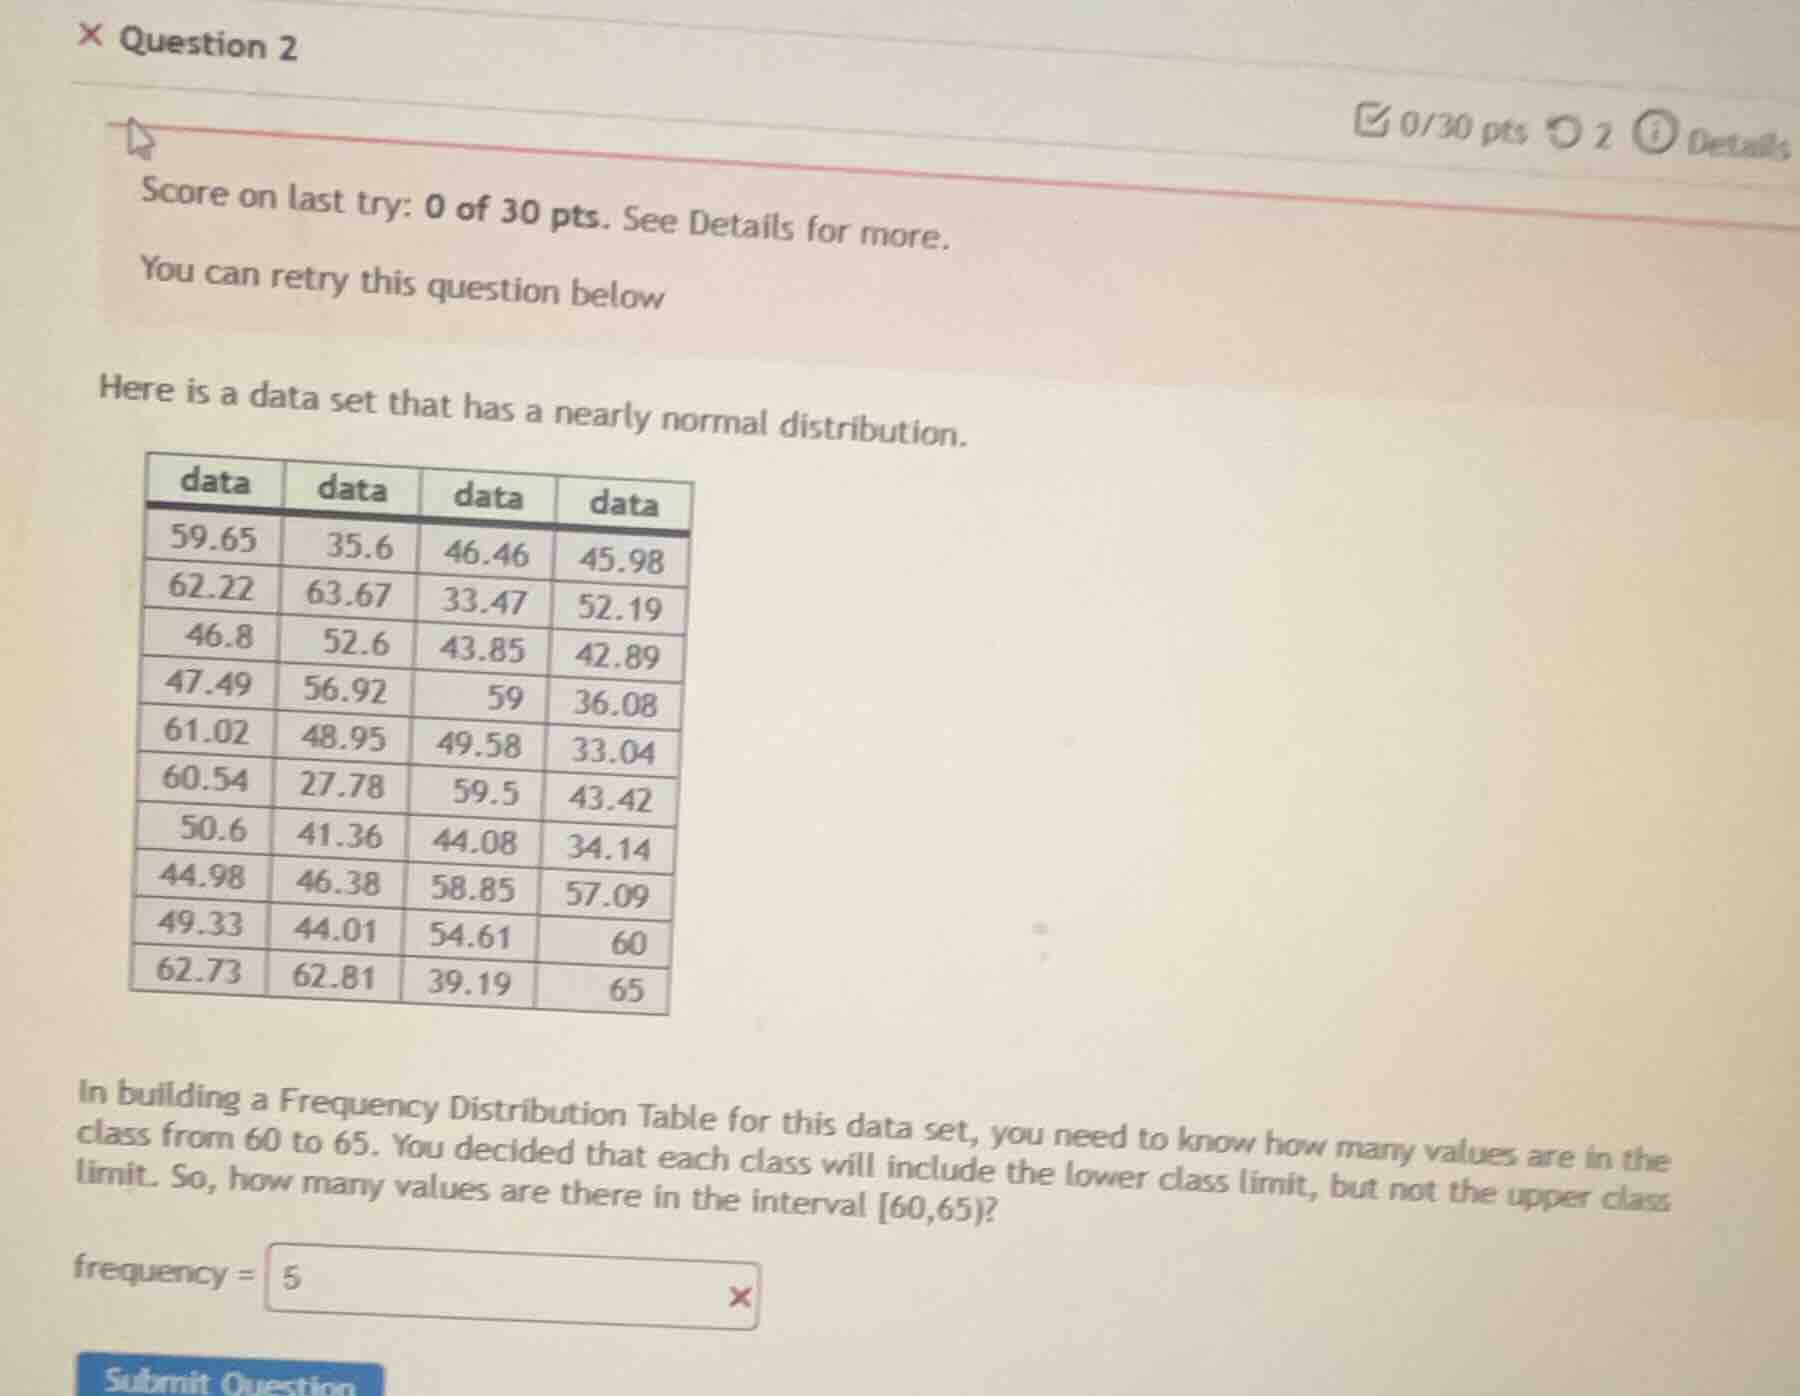
here is a data set that has a nearly normal distribution.
data\tdata\tdata\tdata
59.65\t35.6\t46.46\t45.98
62.22\t63.67\t33.47\t52.19
46.8\t52.6\t43.85\t42.89
47.49\t56.92\t59\t36.08
61.02\t48.95\t49.58\t33.04
60.54\t27.78\t59.5\t43.42
50.6\t41.36\t44.08\t34.14
44.98\t46.38\t58.85\t57.09
49.33\t44.01\t54.61\t60
62.73\t62.81\t39.19\t65
in building a frequency distribution table for this data set, you need to know how many values are in the class from 60 to 65. you decided that each class will include the lower class limit, but not the upper class limit. so, how many values are there in the interval 60,65)?
frequency = 5
Step1: Identify values in [60,65)
List all data values ≥60 and <65:
62.22, 63.67, 61.02, 60.54, 60, 62.73, 62.81
Step2: Count the valid values
Count the number of values from Step1:
$n = 7$

Snap & solve any problem in the app
Get step-by-step solutions on Sovi AI
Photo-based solutions with guided steps
Explore more problems and detailed explanations
7