QUESTION IMAGE
Question
question 3 of 8
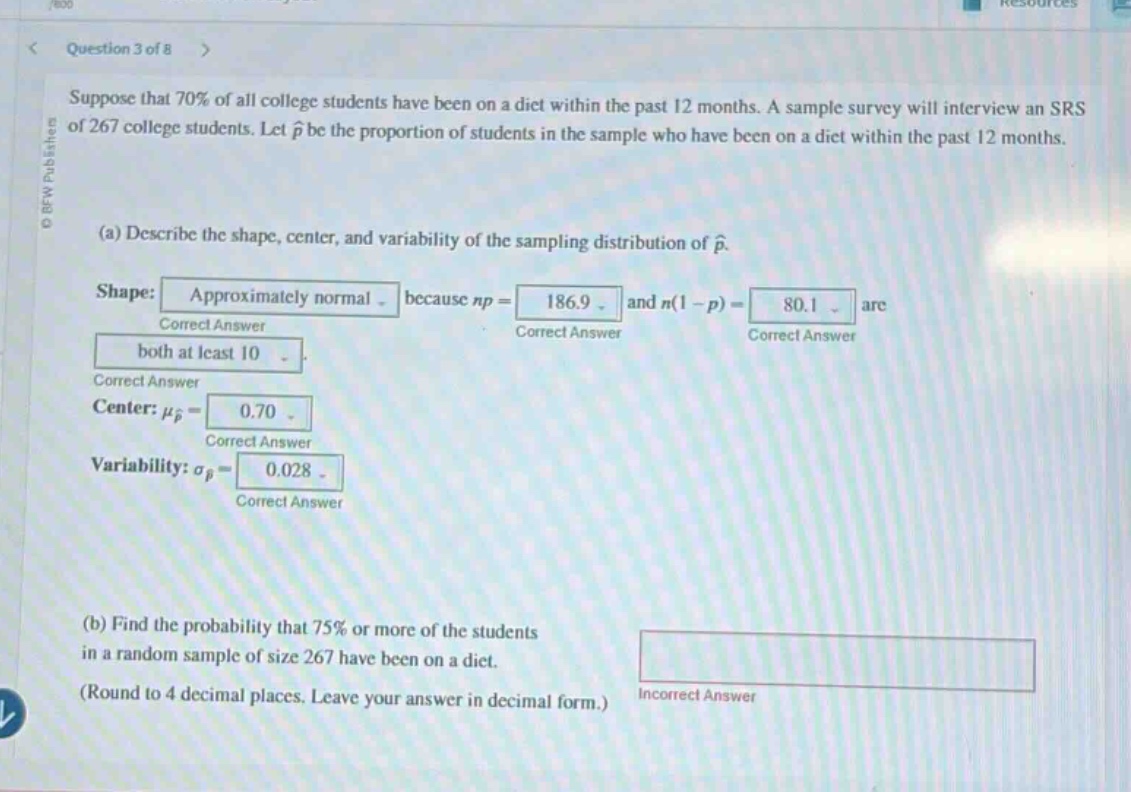
suppose that 70% of all college students have been on a diet within the past 12 months. a sample survey will interview an srs of 267 college students. let \\( \hat{p} \\) be the proportion of students in the sample who have been on a diet within the past 12 months.
(a) describe the shape, center, and variability of the sampling distribution of \\( \hat{p} \\).
shape: approximately normal because \\( np = 186.9 \\) and \\( n(1 - p) = 80.1 \\) are both at least 10.
center: \\( \mu_{\hat{p}} = 0.70 \\)
variability: \\( \sigma_{\hat{p}} = 0.028 \\)
(b) find the probability that 75% or more of the students in a random sample of size 267 have been on a diet.
(round to 4 decimal places. leave your answer in decimal form.)
Step1: Identify the distribution and parameters
We know that the sampling distribution of \(\hat{p}\) is approximately normal with mean \(\mu_{\hat{p}} = p = 0.70\) and standard deviation \(\sigma_{\hat{p}}=\sqrt{\frac{p(1 - p)}{n}}\). Here, \(p = 0.70\), \(n=267\).
Step2: Calculate the z - score
We want to find \(P(\hat{p}\geq0.75)\). First, we calculate the z - score using the formula \(z=\frac{\hat{p}-\mu_{\hat{p}}}{\sigma_{\hat{p}}}\).
Substitute \(\hat{p} = 0.75\), \(\mu_{\hat{p}}=0.70\) and \(\sigma_{\hat{p}} = 0.028\) into the formula:
\(z=\frac{0.75 - 0.70}{0.028}=\frac{0.05}{0.028}\approx1.79\)
Step3: Find the probability
We want \(P(\hat{p}\geq0.75)=P(Z\geq1.79)\). Since the total area under the standard normal curve is 1, \(P(Z\geq1.79)=1 - P(Z < 1.79)\).
Looking up the value of \(P(Z < 1.79)\) in the standard normal table, we find that \(P(Z < 1.79)=0.9633\).
Then \(P(Z\geq1.79)=1 - 0.9633 = 0.0367\)

Snap & solve any problem in the app
Get step-by-step solutions on Sovi AI
Photo-based solutions with guided steps
Explore more problems and detailed explanations
\(0.0367\)