QUESTION IMAGE
Question
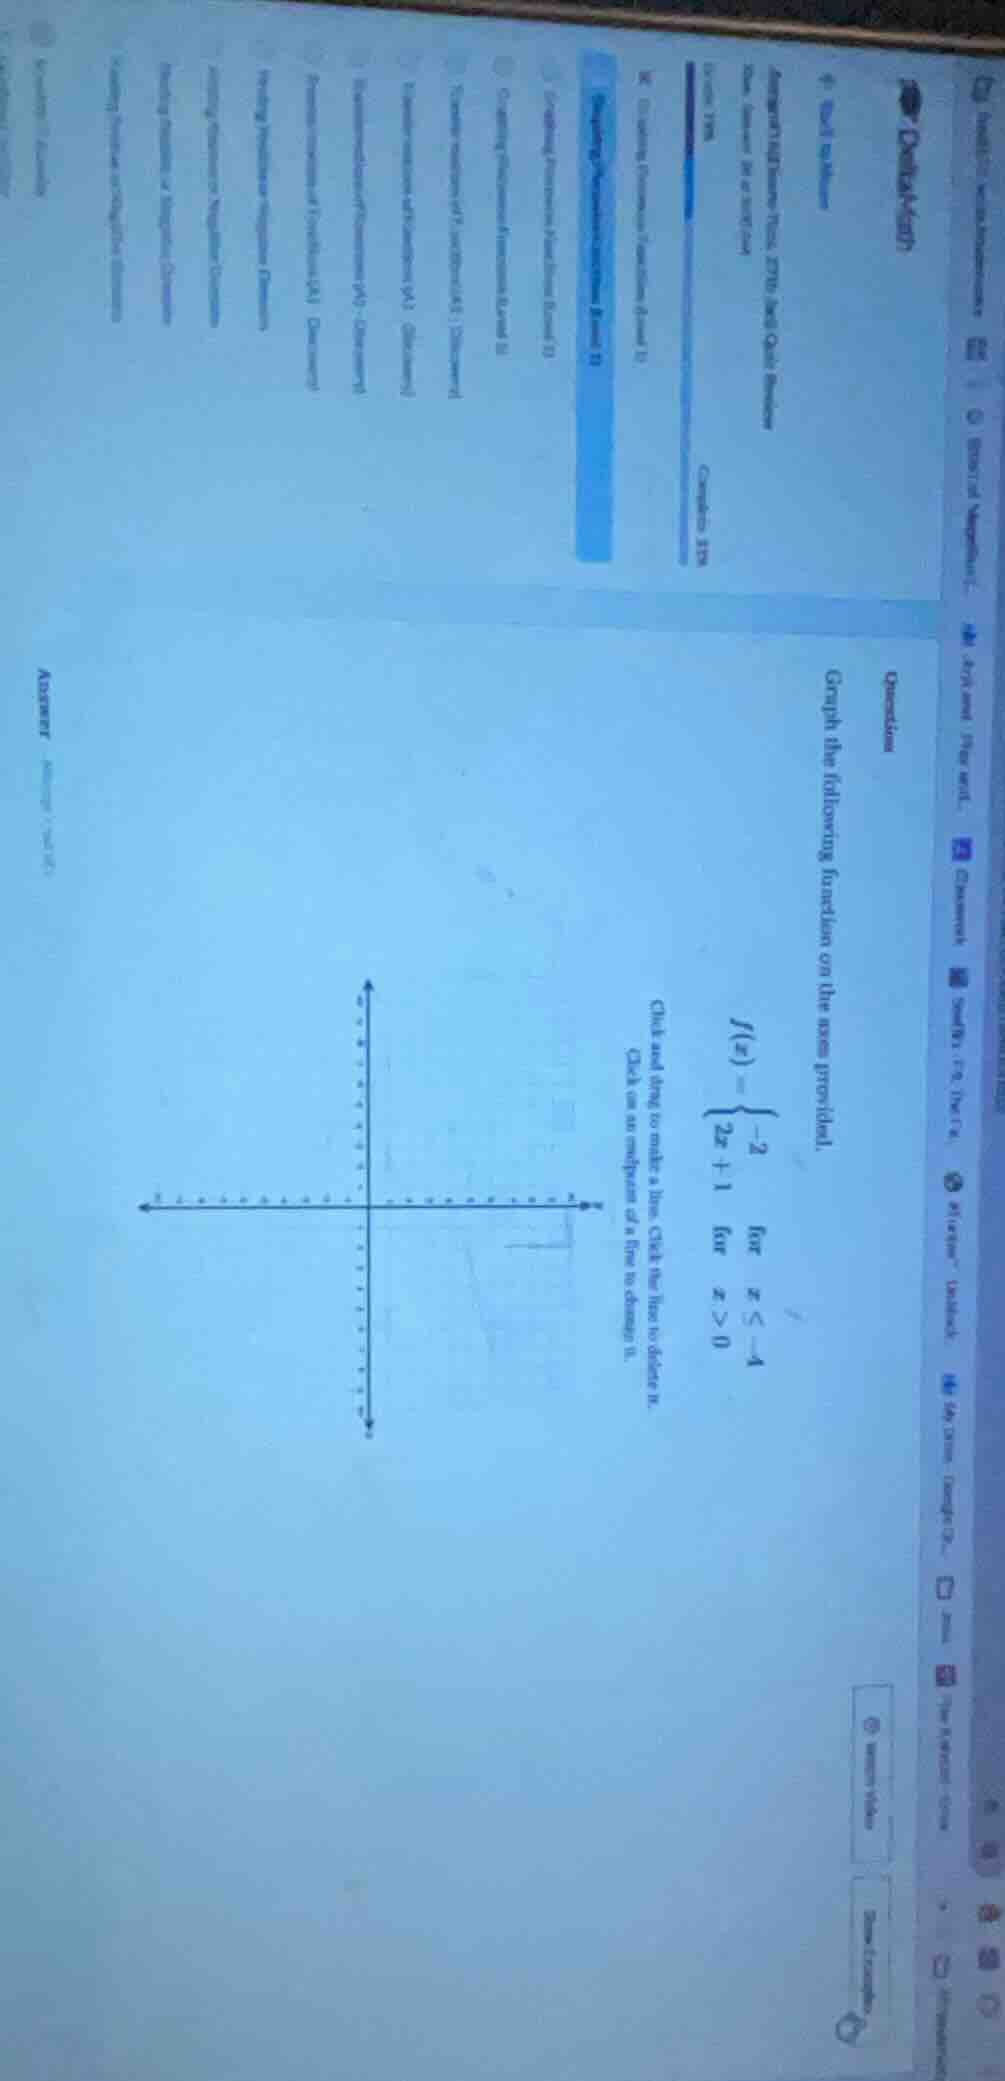
questions graph the following function on the axes provided.
$f(x) = \
$
click and drag to make a line. click the line to delete it. click on an endpoint of a line to delete it.
Step1: Analyze the piecewise function for \( x \leq - 4 \)
The function is \( f(x)=-2 \) for \( x \leq - 4 \). This is a horizontal line. We can find a point on this line. When \( x=-4 \), \( f(-4) = - 2 \). Also, for all \( x \) values less than or equal to - 4, the \( y \)-value is - 2. So we can plot the point \( (-4,-2) \) and draw a horizontal line to the left from this point (since the domain is \( x\leq - 4\)).
Step2: Analyze the piecewise function for \( x>0 \)
The function is \( f(x) = 2x + 1 \) for \( x>0 \). This is a linear function in the form \( y=mx + b \) where \( m = 2 \) (slope) and \( b=1 \) (y-intercept). We need to find a point in the domain \( x > 0 \). Let's take \( x = 0 \), but since \( x>0 \), we can take \( x = 1 \). When \( x = 1 \), \( f(1)=2(1)+1=3 \). So the point \( (1,3) \) is on the line. We can also find the value as \( x \) approaches 0 from the right. As \( x
ightarrow0^{+} \), \( f(x)
ightarrow2(0)+1 = 1 \). So we can draw a line with slope 2 starting from the point \( (0,1) \) (but not including \( x = 0 \)) and going to the right (since \( x>0 \)).
Graph Description (since we can't draw here but can describe the steps to graph):
- For the part \( f(x)=-2, x\leq - 4 \): Plot the point \( (-4,-2) \) and draw a horizontal line to the left (for all \( x\leq - 4 \)).
- For the part \( f(x)=2x + 1, x>0 \): Plot the point \( (1,3) \) (or any other point with \( x>0 \)) and draw a line with slope 2 (rising 2 units for every 1 unit run to the right) starting from near \( (0,1) \) (not including \( x = 0 \)) and extending to the right.
(Note: If we were to actually graph it, we would use the point - plotting and slope - using method as described above. The key points are \( (-4,-2) \) for the horizontal line and points like \( (1,3) \), \( (2,5) \) etc. for the line \( y = 2x+1 \) with \( x>0 \))
Since the question is about graphing a piecewise function, the main steps involve analyzing each piece of the piecewise function (identifying the type of function, finding key points, and determining the domain for each piece) and then plotting those pieces on the coordinate plane.

Snap & solve any problem in the app
Get step-by-step solutions on Sovi AI
Photo-based solutions with guided steps
Explore more problems and detailed explanations
Step1: Analyze the piecewise function for \( x \leq - 4 \)
The function is \( f(x)=-2 \) for \( x \leq - 4 \). This is a horizontal line. We can find a point on this line. When \( x=-4 \), \( f(-4) = - 2 \). Also, for all \( x \) values less than or equal to - 4, the \( y \)-value is - 2. So we can plot the point \( (-4,-2) \) and draw a horizontal line to the left from this point (since the domain is \( x\leq - 4\)).
Step2: Analyze the piecewise function for \( x>0 \)
The function is \( f(x) = 2x + 1 \) for \( x>0 \). This is a linear function in the form \( y=mx + b \) where \( m = 2 \) (slope) and \( b=1 \) (y-intercept). We need to find a point in the domain \( x > 0 \). Let's take \( x = 0 \), but since \( x>0 \), we can take \( x = 1 \). When \( x = 1 \), \( f(1)=2(1)+1=3 \). So the point \( (1,3) \) is on the line. We can also find the value as \( x \) approaches 0 from the right. As \( x
ightarrow0^{+} \), \( f(x)
ightarrow2(0)+1 = 1 \). So we can draw a line with slope 2 starting from the point \( (0,1) \) (but not including \( x = 0 \)) and going to the right (since \( x>0 \)).
Graph Description (since we can't draw here but can describe the steps to graph):
- For the part \( f(x)=-2, x\leq - 4 \): Plot the point \( (-4,-2) \) and draw a horizontal line to the left (for all \( x\leq - 4 \)).
- For the part \( f(x)=2x + 1, x>0 \): Plot the point \( (1,3) \) (or any other point with \( x>0 \)) and draw a line with slope 2 (rising 2 units for every 1 unit run to the right) starting from near \( (0,1) \) (not including \( x = 0 \)) and extending to the right.
(Note: If we were to actually graph it, we would use the point - plotting and slope - using method as described above. The key points are \( (-4,-2) \) for the horizontal line and points like \( (1,3) \), \( (2,5) \) etc. for the line \( y = 2x+1 \) with \( x>0 \))
Since the question is about graphing a piecewise function, the main steps involve analyzing each piece of the piecewise function (identifying the type of function, finding key points, and determining the domain for each piece) and then plotting those pieces on the coordinate plane.