QUESTION IMAGE
Question
read the passage and answer the following question(s).
passage 0649
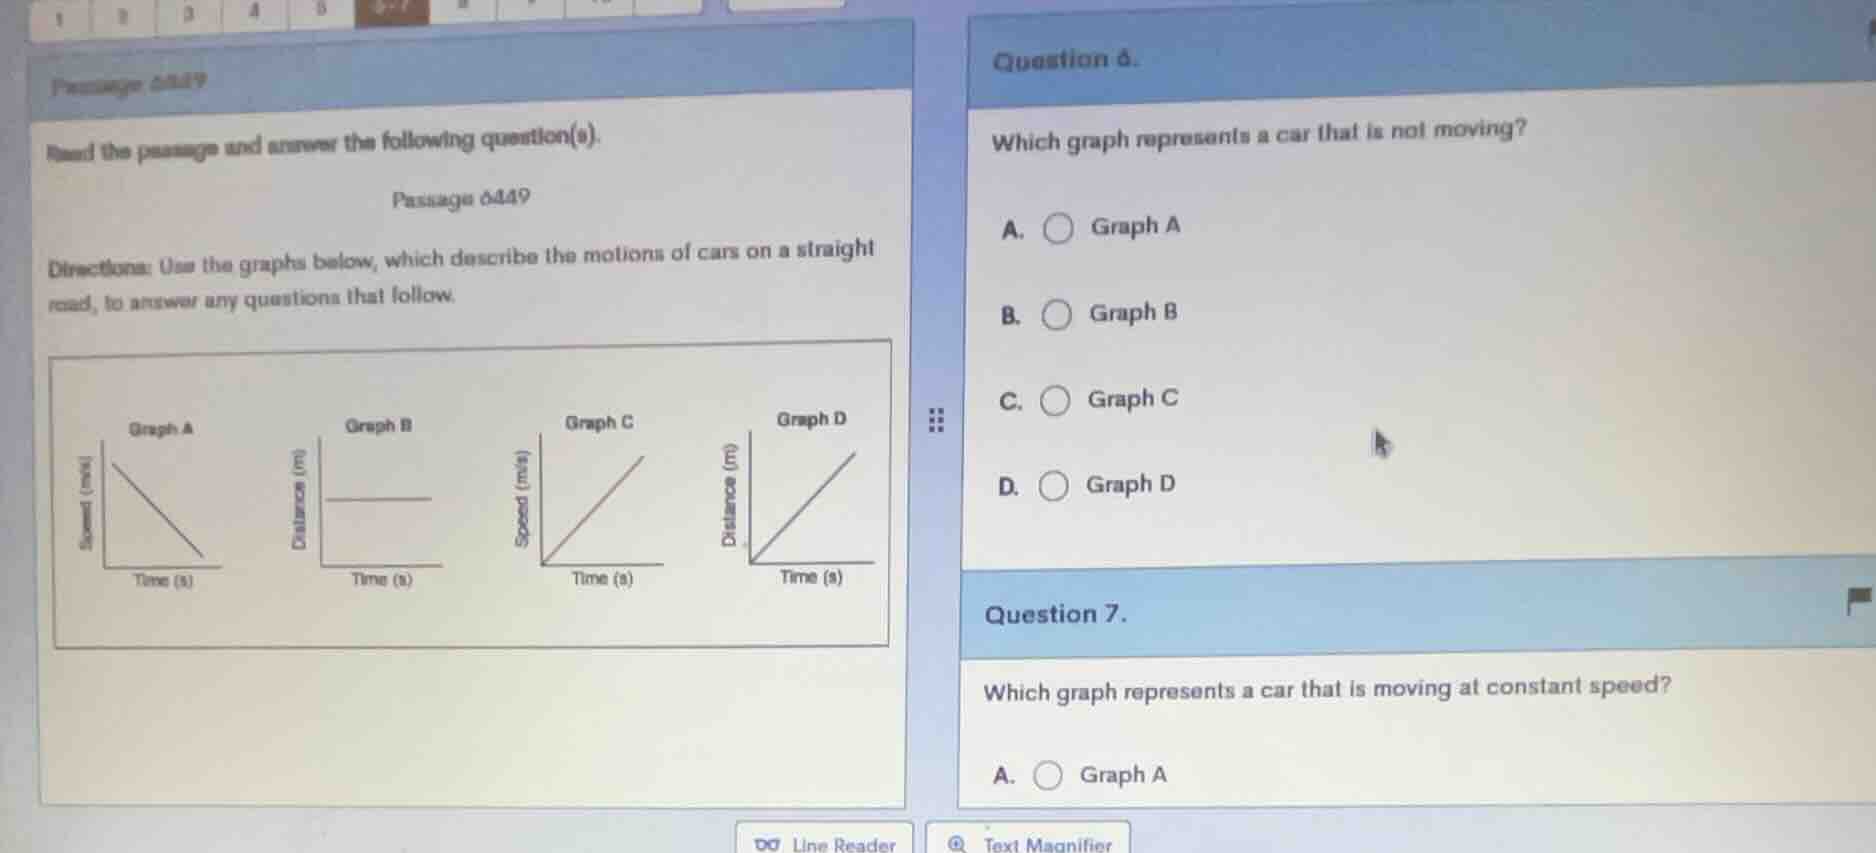
directions: use the graphs below, which describe the motions of cars on a straight road, to answer any questions that follow.
(graphs: graph a: speed vs time (decreasing line), graph b: distance vs time (horizontal line), graph c: speed vs time (increasing line from origin), graph d: distance vs time (increasing line from origin))
question 6.
which graph represents a car that is not moving?
a. graph a
b. graph b
c. graph c
d. graph d
question 7.
which graph represents a car that is moving at constant speed?
a. graph a
Question 6
To determine which graph represents a car that is not moving, we analyze the relationship between distance and time (or speed and time). A car not moving has a constant distance over time (speed = 0).
- Graph A: Speed decreases over time (decelerating).
- Graph B: Distance remains constant as time increases, meaning the car's position doesn't change (not moving).
- Graph C: Speed increases over time (accelerating).
- Graph D: Distance increases linearly with time (constant speed, moving).
So Graph B shows a car not moving.
For a car moving at constant speed, the distance - time graph should be a straight line with a constant slope (since speed = distance/time, constant speed means distance ∝ time), or the speed - time graph should be a horizontal line (constant speed).
- Graph A: Speed decreases over time (deceleration, not constant speed).
- Graph B: Distance is constant (car not moving, speed = 0, but we need moving at constant speed; however, re - evaluating: Wait, no—wait, for constant speed, distance - time is linear (Graph D) or speed - time is horizontal. Wait, maybe I made a mistake earlier. Wait, let's re - analyze:
- Graph A: Speed vs time, speed is decreasing (non - constant speed).
- Graph B: Distance vs time, distance constant (speed = 0, not moving).
- Graph C: Speed vs time, speed increasing (accelerating, non - constant speed).
- Graph D: Distance vs time, distance increases linearly with time. Since speed $v=\frac{\Delta d}{\Delta t}$, a linear distance - time graph with constant slope means constant speed. Also, if we consider speed - time, a horizontal line is constant speed, but here Graph D is distance - time linear. So Graph D represents constant speed. Wait, but maybe the options: Wait, the question is "Which graph represents a car that is moving at constant speed?" Let's check again:
- Graph A: Speed (y - axis) vs time (x - axis), line with negative slope (deceleration, speed changing).
- Graph B: Distance (y - axis) vs time (x - axis), horizontal line (speed = 0, not moving).
- Graph C: Speed (y - axis) vs time (x - axis), line with positive slope (acceleration, speed changing).
- Graph D: Distance (y - axis) vs time (x - axis), line with positive slope (constant slope, so constant speed as $v = \frac{\Delta d}{\Delta t}$ is constant).
So Graph D represents a car moving at constant speed. Wait, but maybe the intended answer is also considering Graph A? No, Graph A is decelerating. Wait, perhaps I messed up Question 6 and 7. Wait, let's correct:
For Question 6, Graph B is correct (not moving). For Question 7, a car moving at constant speed:
- In distance - time graph: linear (Graph D).
- In speed - time graph: horizontal (but there is no horizontal speed - time graph here except if we misread. Wait, the graphs: Graph A is speed vs time (decreasing), Graph B distance vs time (constant), Graph C speed vs time (increasing), Graph D distance vs time (increasing linearly). So constant speed in distance - time is linear (Graph D), and in speed - time is horizontal. Since there's no horizontal speed - time graph, Graph D is the one with constant speed (moving at constant speed as distance changes at constant rate).
So the answer for Question 7 is D. Graph D.

Snap & solve any problem in the app
Get step-by-step solutions on Sovi AI
Photo-based solutions with guided steps
Explore more problems and detailed explanations
B. Graph B