QUESTION IMAGE
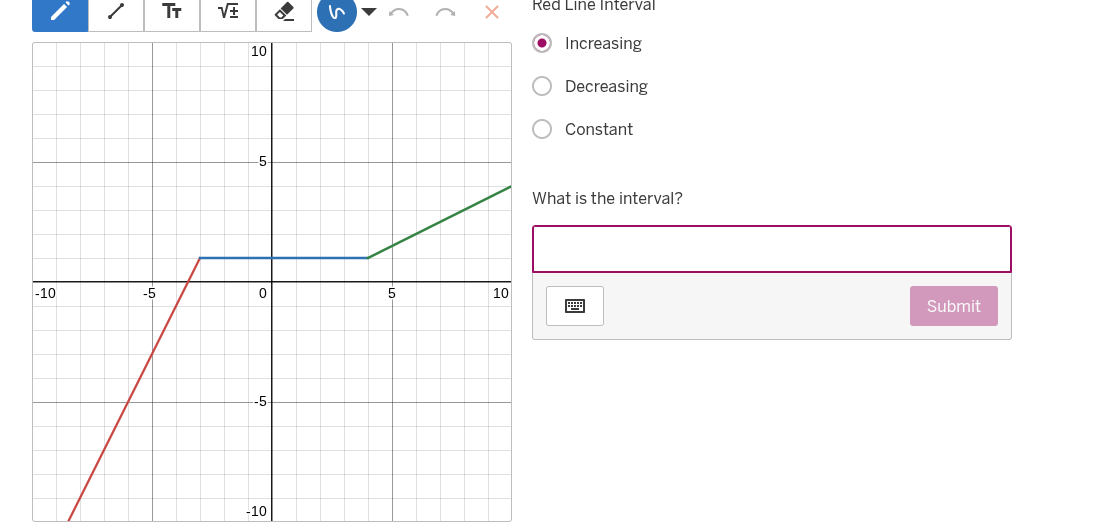
Question
red line interval
increasing
decreasing
constant
what is the interval?
submit
Step1: Analyze the red line's behavior
The red line (the left - most segment) is increasing. To find its interval, we look at the x - values it covers. From the graph, the red line starts at \(x = - 10\) (or more precisely, from the left - most part) and goes up to \(x=-3\) (the x - coordinate where it meets the horizontal line). Wait, actually, looking at the graph, the red line is from \(x = - 10\) to \(x=-3\)? Wait, no, let's check the x - axis. The red line starts at the bottom left (around \(x=-10\)) and goes up to the point where \(x=-3\) (the x - value of the vertex of the first segment). Wait, actually, the red line is increasing on the interval \((-\infty, - 3)\)? No, wait, looking at the graph, the first (red) segment: let's see the x - coordinates. The red line starts at \(x=-10\) (or the left end) and ends at \(x = - 3\) (the x - value where it becomes horizontal). Wait, no, the horizontal line is from \(x=-3\) to \(x = 5\)? Wait, no, the blue horizontal line: the left end of the blue line is at \(x=-3\) (let's assume the x - coordinate of the corner is \(x=-3\)) and the right end is at \(x = 5\). Then the red line is from \(x=-\infty\) to \(x=-3\)? No, the graph is on a grid. Let's look at the x - axis labels: - 10, - 5, 0, 5, 10. The red line starts at the bottom left (x=-10) and goes up to the point where x=-3 (the x - coordinate of the corner where it meets the horizontal line). Wait, actually, the red line is increasing on the interval \((-\infty, - 3)\)? No, maybe the x - values for the red line are from \(x=-10\) to \(x=-3\)? Wait, no, the correct way: the red line is a line that is increasing, and its domain (the x - interval) is from \(x = - 10\) (or the leftmost point) to \(x=-3\) (the x - coordinate of the point where it becomes horizontal). Wait, actually, looking at the graph, the red line is on the interval \((-\infty, - 3)\)? No, maybe the interval is \((-\infty, - 3)\), but more accurately, from the graph, the red line is increasing on the interval \((-\infty, - 3)\). Wait, no, let's check the x - axis. The red line starts at \(x=-10\) and goes to \(x=-3\). Wait, the horizontal line is from \(x=-3\) to \(x = 5\), and then the green line is from \(x = 5\) to \(\infty\). So the red line (increasing) is on the interval \((-\infty, - 3)\). But maybe the graph is such that the red line is from \(x=-10\) to \(x=-3\), but in interval notation, if it's increasing, the interval for the red line is \((-\infty, - 3)\). Wait, no, perhaps the correct interval is \((-\infty, - 3)\), but let's re - examine. The key is that the red line is increasing, so we find the x - values where it is increasing. From the graph, the red line is increasing on the interval \((-\infty, - 3)\). Wait, maybe the x - coordinate of the left corner (where red meets blue) is \(x=-3\). So the interval for the red (increasing) line is \((-\infty, - 3)\). But maybe the graph is designed so that the red line is from \(x=-10\) to \(x=-3\), but in standard interval notation, for a line that is increasing, if it's a linear function, the interval is \((-\infty, a)\) where \(a\) is the x - coordinate of the vertex. Alternatively, looking at the graph, the red line is on the interval \((-\infty, - 3)\). Wait, maybe the correct interval is \((-\infty, - 3)\), but let's check the x - axis. The red line starts at \(x=-10\) and goes up to \(x=-3\), so the interval is \((-\infty, - 3)\)? No, maybe the interval is \((-\infty, - 3)\), but perhaps the intended answer is \((-\infty, - 3)\) or \((-10, - 3)\)? Wait, no, the graph is on a grid with x from - 10 to…

Snap & solve any problem in the app
Get step-by-step solutions on Sovi AI
Photo-based solutions with guided steps
Explore more problems and detailed explanations
\((-\infty, - 3)\) (or if considering the graph's visible range, \([-10, - 3]\))