QUESTION IMAGE
Question
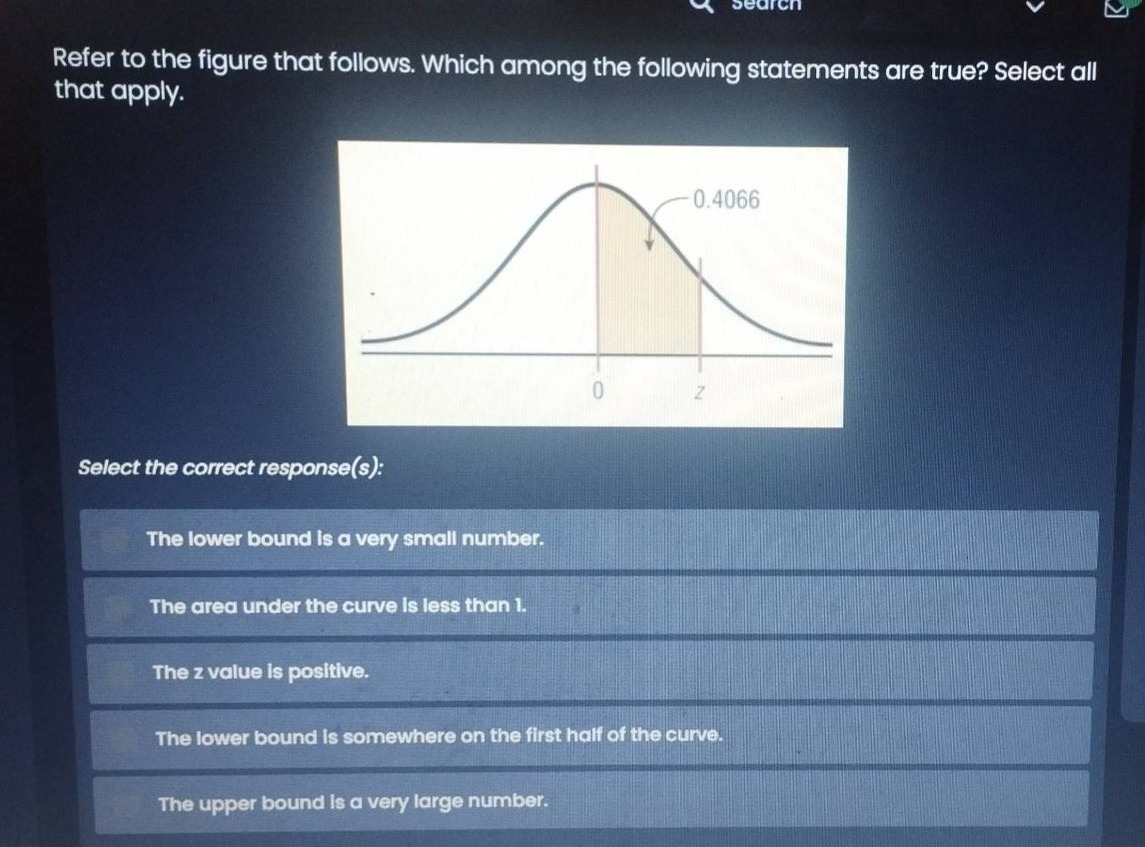
refer to the figure that follows. which among the following statements are true? select all that apply. select the correct response(s): the lower bound is a very small number. the area under the curve is less than 1. the z value is positive. the lower bound is somewhere on the first half of the curve. the upper bound is a very large number.
Brief Explanations
- The shaded area is to the right of 0 on the standard normal curve, so z must be positive.
- The total area under a normal distribution curve is 1. The shaded region is only a portion of this area (0.4066), so the area under the curve for this region is less than 1.
- The lower bound here is 0 (not a very small number, nor on the "first half" left of the mean), and the upper bound is z (a finite positive value, not a very large number), so those statements are false.

Snap & solve any problem in the app
Get step-by-step solutions on Sovi AI
Photo-based solutions with guided steps
Explore more problems and detailed explanations
The z value is positive.
The area under the curve is less than 1.