QUESTION IMAGE
Question
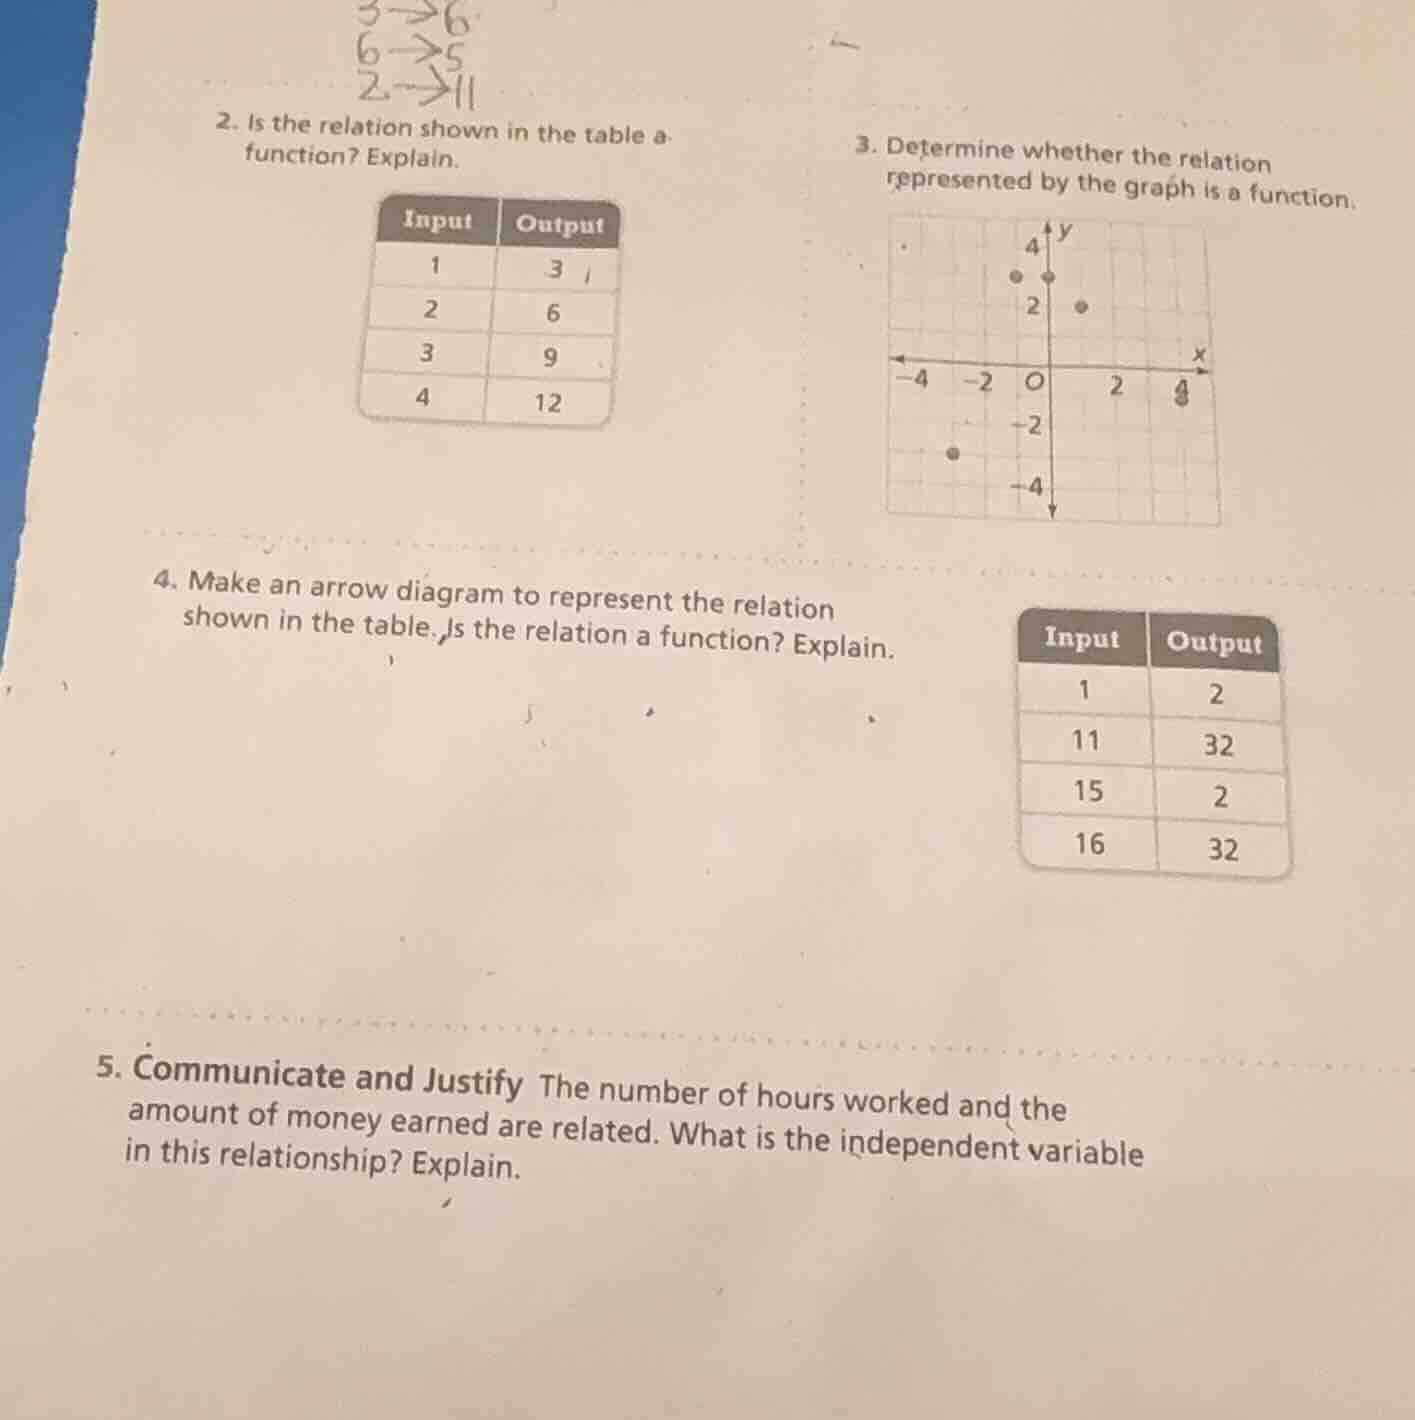
- is the relation shown in the table a function? explain.
input output
1 3
2 6
3 9
4 12
- determine whether the relation represented by the graph is a function.
- make an arrow diagram to represent the relation shown in the table. is the relation a function? explain.
input output
1 2
11 32
15 2
16 32
- communicate and justify the number of hours worked and the amount of money earned are related. what is the independent variable in this relationship? explain.
Question 2
Step1: Recall function definition
A relation is a function if each input has exactly one output.
Step2: Check table inputs/outputs
Input 1 → 3, 2 → 6, 3 → 9, 4 → 12. Each input has one output.
Step1: Recall vertical line test
A graph represents a function if no vertical line intersects the graph more than once.
Step2: Apply vertical line test
Looking at the graph, when we draw a vertical line (e.g., at \( x = 0 \)), it intersects multiple points (the dots on the y - axis). So, the graph fails the vertical line test.
Step1: Create arrow diagram
Inputs: 1, 11, 15, 16; Outputs: 2, 32. Draw arrows: 1→2, 11→32, 15→2, 16→32.
Step2: Check function definition
A function requires each input to have exactly one output. Here, 1 has one output (2), 11 has one (32), 15 has one (2), 16 has one (32). Even though multiple inputs can map to the same output, each input has a unique output (for itself).

Snap & solve any problem in the app
Get step-by-step solutions on Sovi AI
Photo-based solutions with guided steps
Explore more problems and detailed explanations
Yes, the relation is a function. Because each input (1, 2, 3, 4) has exactly one output (3, 6, 9, 12) respectively, satisfying the definition of a function (each input maps to exactly one output).