QUESTION IMAGE
Question
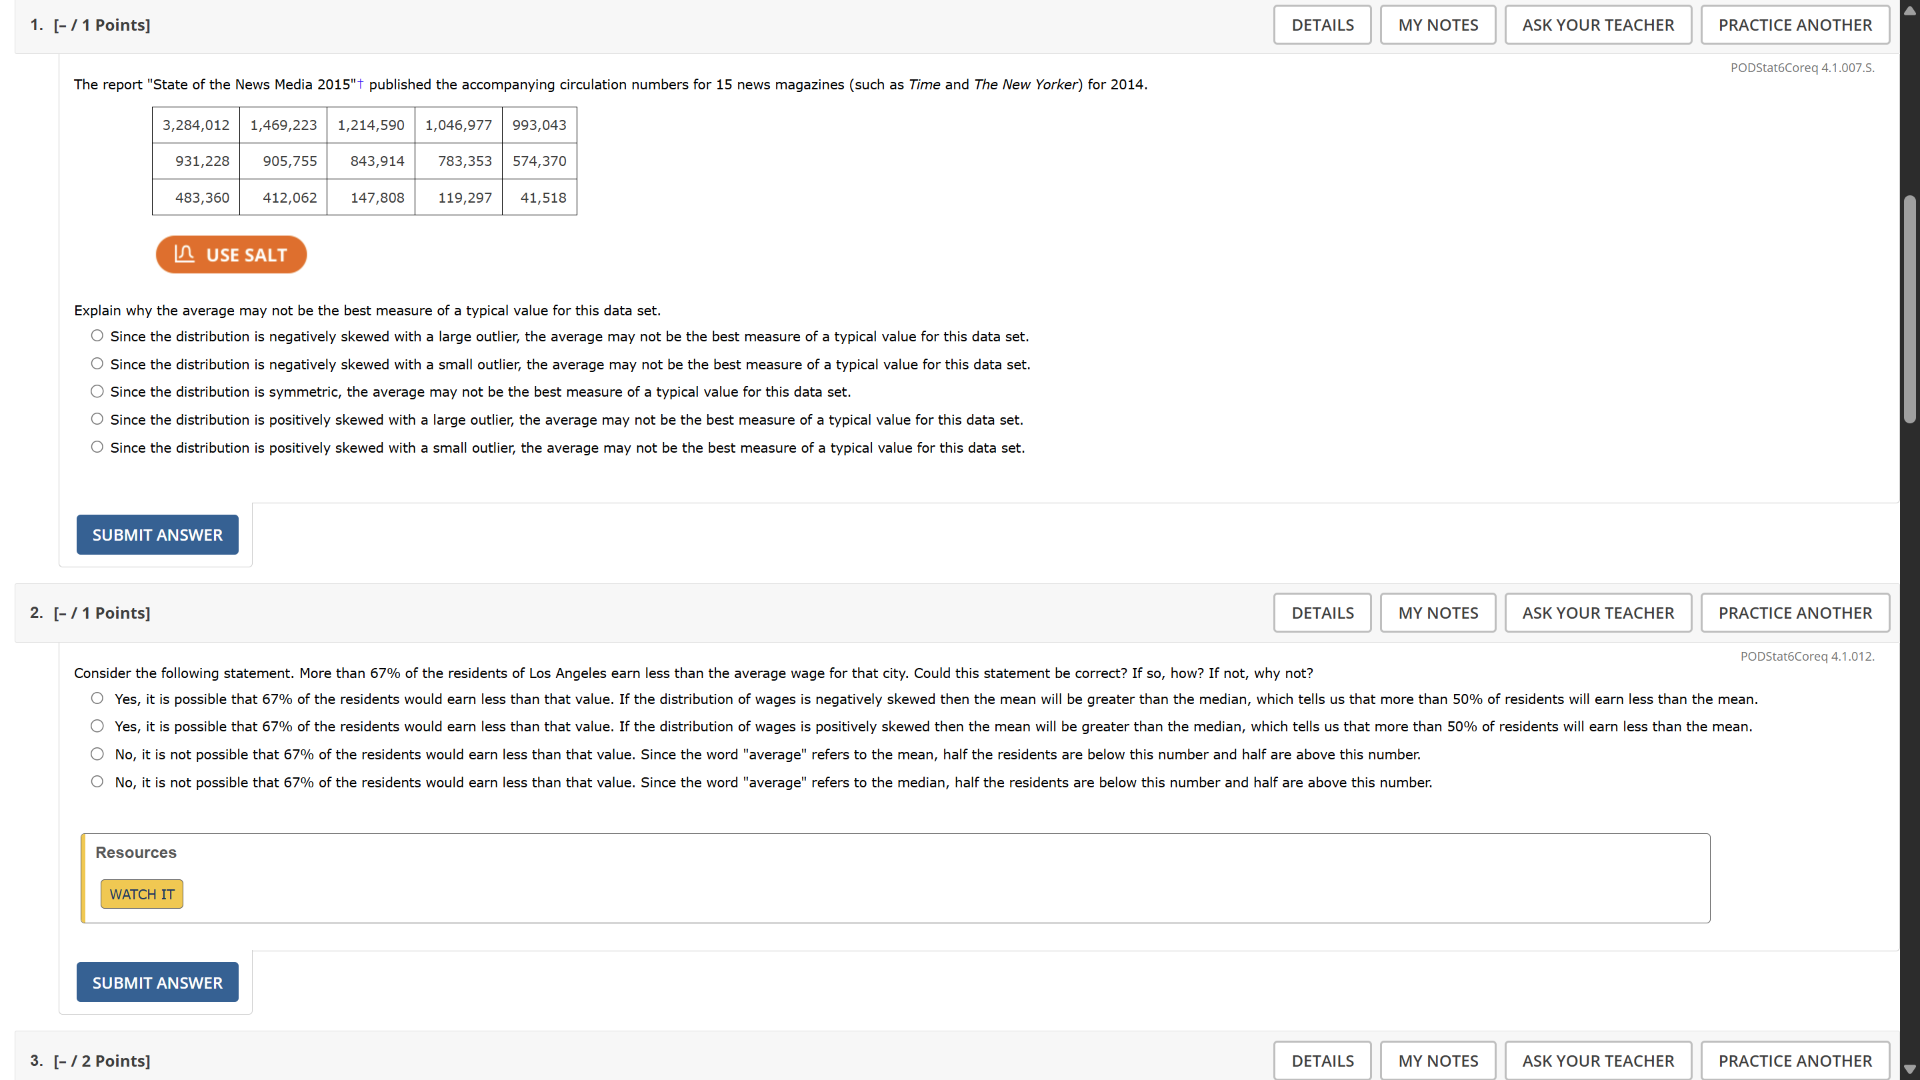
- the report \state of the news media 2015\ published the accompanying circulation numbers for 15 news magazines (such as time and the new yorker) for 2014. 3,284,012 1,469,223 1,214,590 1,046,977 993,043 931,228 905,755 843,914 783,353 574,370 483,360 412,062 147,808 119,297 41,518 explain why the average may not be the best measure of a typical value for this data set. \\(\circ\\) since the distribution is negatively skewed with a large outlier, the average may not be the best measure of a typical value for this data set. \\(\circ\\) since the distribution is negatively skewed with a small outlier, the average may not be the best measure of a typical value for this data set. \\(\circ\\) since the distribution is symmetric, the average may not be the best measure of a typical value for this data set. \\(\circ\\) since the distribution is positively skewed with a large outlier, the average may not be the best measure of a typical value for this data set. \\(\circ\\) since the distribution is positively skewed with a small outlier, the average may not be the best measure of a typical value for this data set. 2. consider the following statement. more than 67% of the residents of los angeles earn less than the average wage for that city. could this statement be correct? if so, how? if not, why not? \\(\circ\\) yes, it is possible that 67% of the residents would earn less than that value. if the distribution of wages is negatively skewed then the mean will be greater than the median, which tells us that more than 50% of residents will earn less than the mean. \\(\circ\\) yes, it is possible that 67% of the residents would earn less than that value. if the distribution of wages is positively skewed then the mean will be greater than the median, which tells us that more than 50% of residents will earn less than the mean. \\(\circ\\) no, it is not possible that 67% of the residents would earn less than that value. since the word \average\ refers to the mean, half the residents are below this number and half are above this number. \\(\circ\\) no, it is not possible that 67% of the residents would earn less than that value. since the word \average\ refers to the median, half the residents are below this number and half are above this number. 3.
Question 1
To determine why the average may not be the best measure, we analyze the data set. The circulation numbers have a large value (3,284,012) and most other values are much smaller. A positively skewed distribution has a long tail on the right (high values), and a large outlier (the high circulation number) pulls the mean up. In such cases, the median is a better measure of a typical value as the mean is influenced by the outlier. So the correct option is the one stating the distribution is positively skewed with a large outlier.
When wages are positively skewed, the mean (average) is pulled up by high - income outliers. The median is the middle value, so more than 50% of the data lies below the mean (average). So it is possible that more than 67% of residents earn less than the average wage if the distribution is positively skewed.

Snap & solve any problem in the app
Get step-by-step solutions on Sovi AI
Photo-based solutions with guided steps
Explore more problems and detailed explanations
D. Since the distribution is positively skewed with a large outlier, the average may not be the best measure of a typical value for this data set.