QUESTION IMAGE
Question
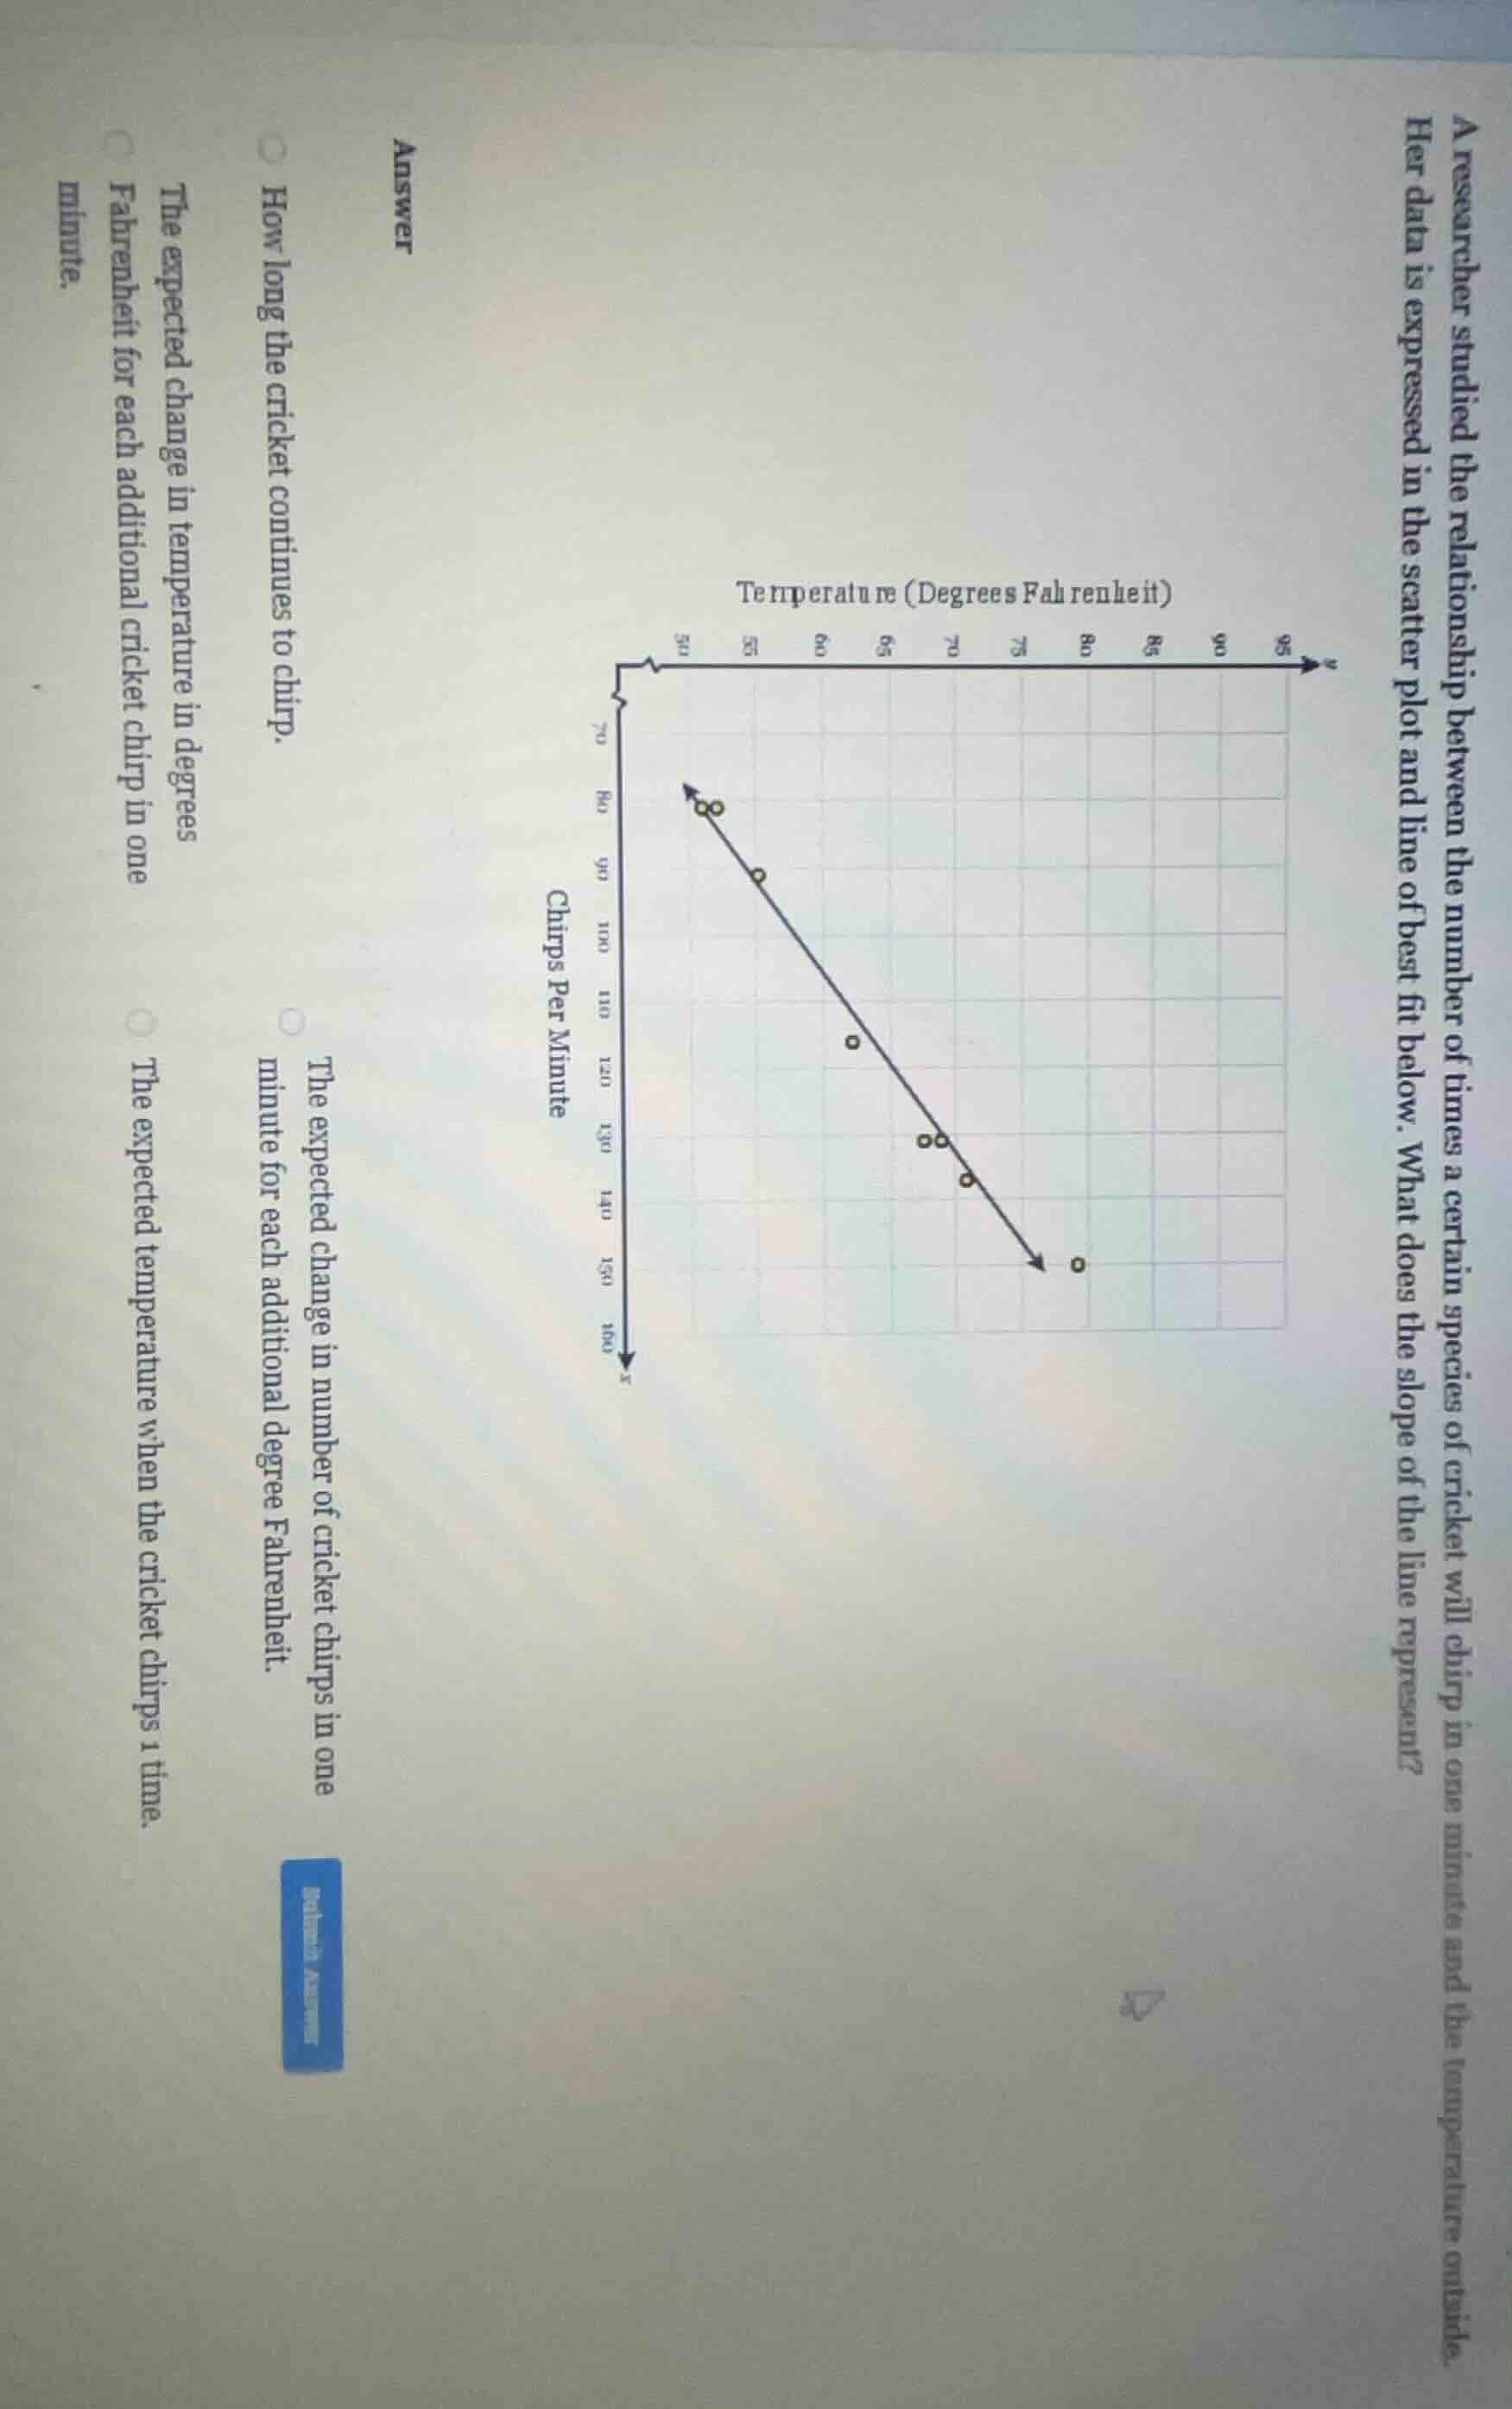
a researcher studied the relationship between the number of times a certain species of cricket will chirp in one minute and the temperature outside. her data is expressed in the scatter plot and line of best fit below. what does the slope of the line represent?
answer
how long the cricket continues to chirp.
the expected change in temperature in degrees fahrenheit for each additional cricket chirp in one minute.
the expected change in number of cricket chirps in one minute for each additional degree fahrenheit.
the expected temperature when the cricket chirps 1 time.
The slope of a line of best fit represents the expected change in the dependent variable (y-axis, Temperature) for each 1-unit change in the independent variable (x-axis, Chirps Per Minute). Among the options, this matches the description of the expected temperature change per additional chirp.

Snap & solve any problem in the app
Get step-by-step solutions on Sovi AI
Photo-based solutions with guided steps
Explore more problems and detailed explanations
The expected temperature in degrees Fahrenheit for each additional cricket chirp in one minute.