QUESTION IMAGE
Question
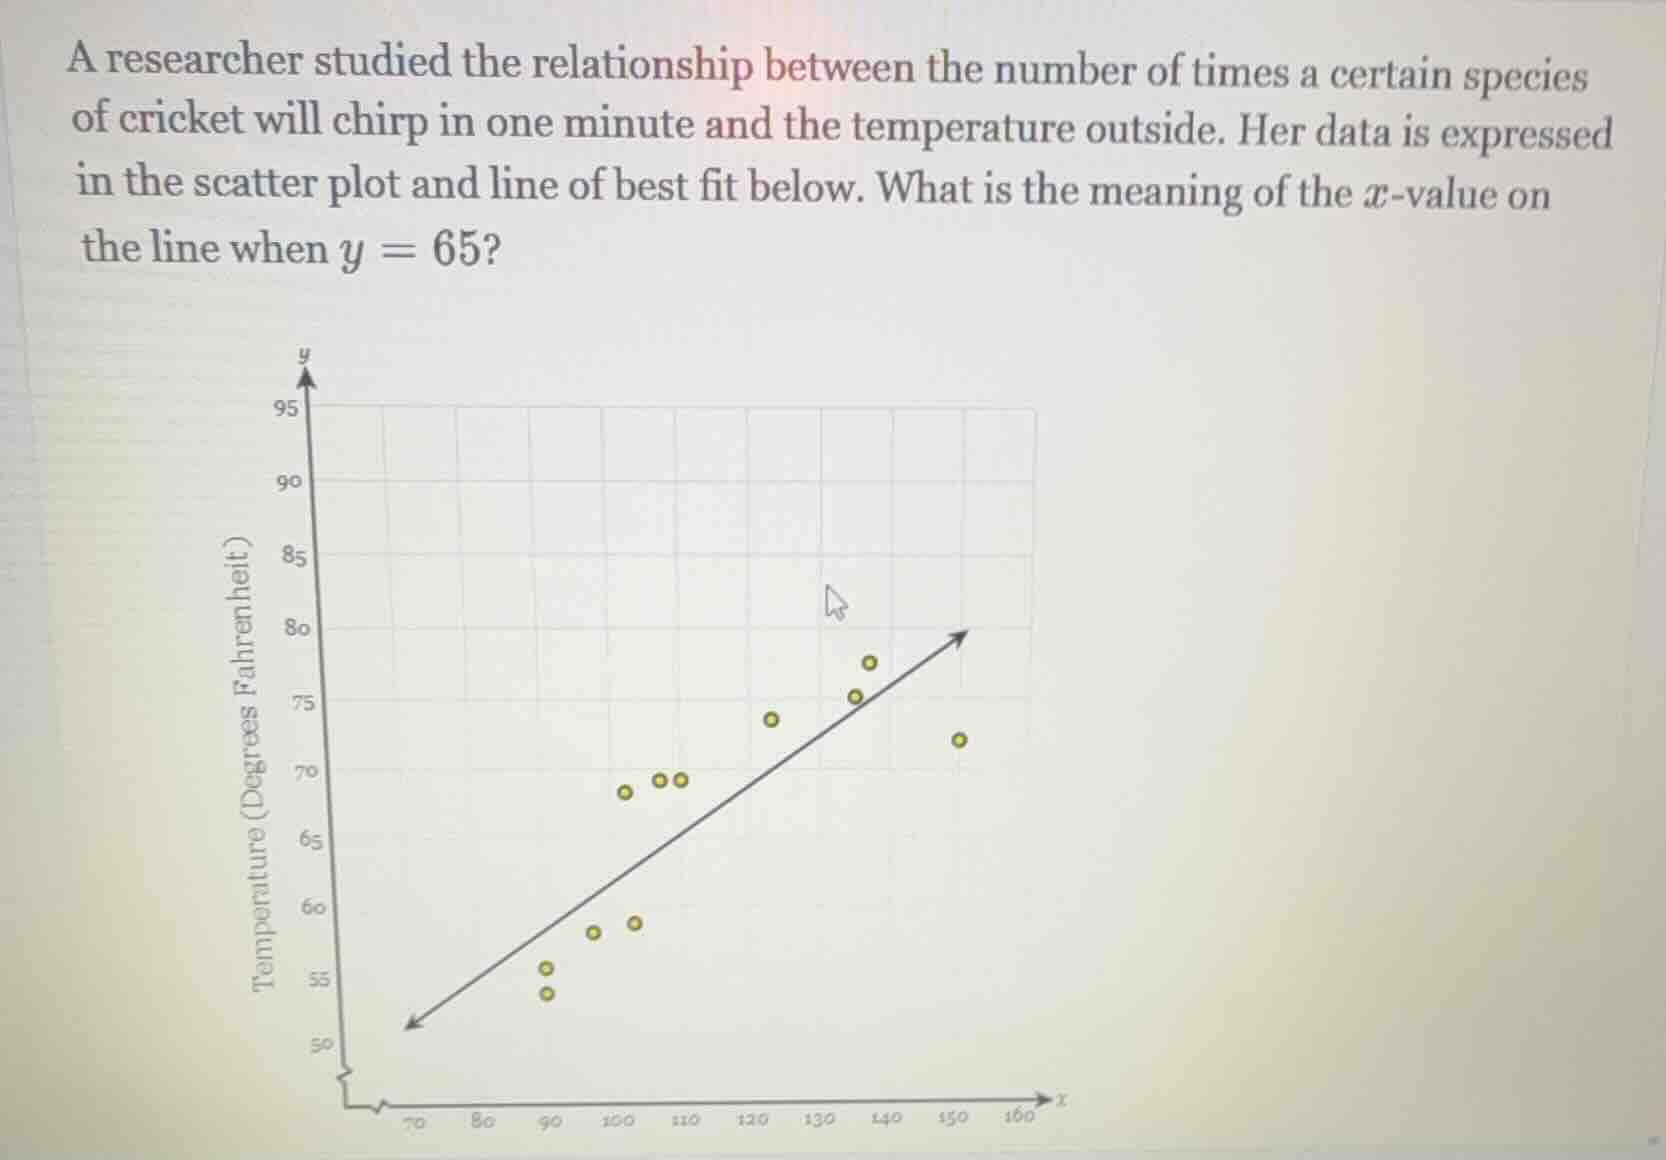
a researcher studied the relationship between the number of times a certain species of cricket will chirp in one minute and the temperature outside. her data is expressed in the scatter plot and line of best fit below. what is the meaning of the $x$-value on the line when $y = 65$?
First, identify the variables: the y-axis represents temperature (Degrees Fahrenheit), and the x-axis represents the number of cricket chirps per minute. The line of best fit models the relationship between these two variables. When $y=65$, we are looking at the x-value on this line, which corresponds to the predicted number of chirps per minute for that temperature.

Snap & solve any problem in the app
Get step-by-step solutions on Sovi AI
Photo-based solutions with guided steps
Explore more problems and detailed explanations
The x-value represents the predicted number of times the cricket species will chirp in one minute when the outside temperature is 65 degrees Fahrenheit.