QUESTION IMAGE
Question
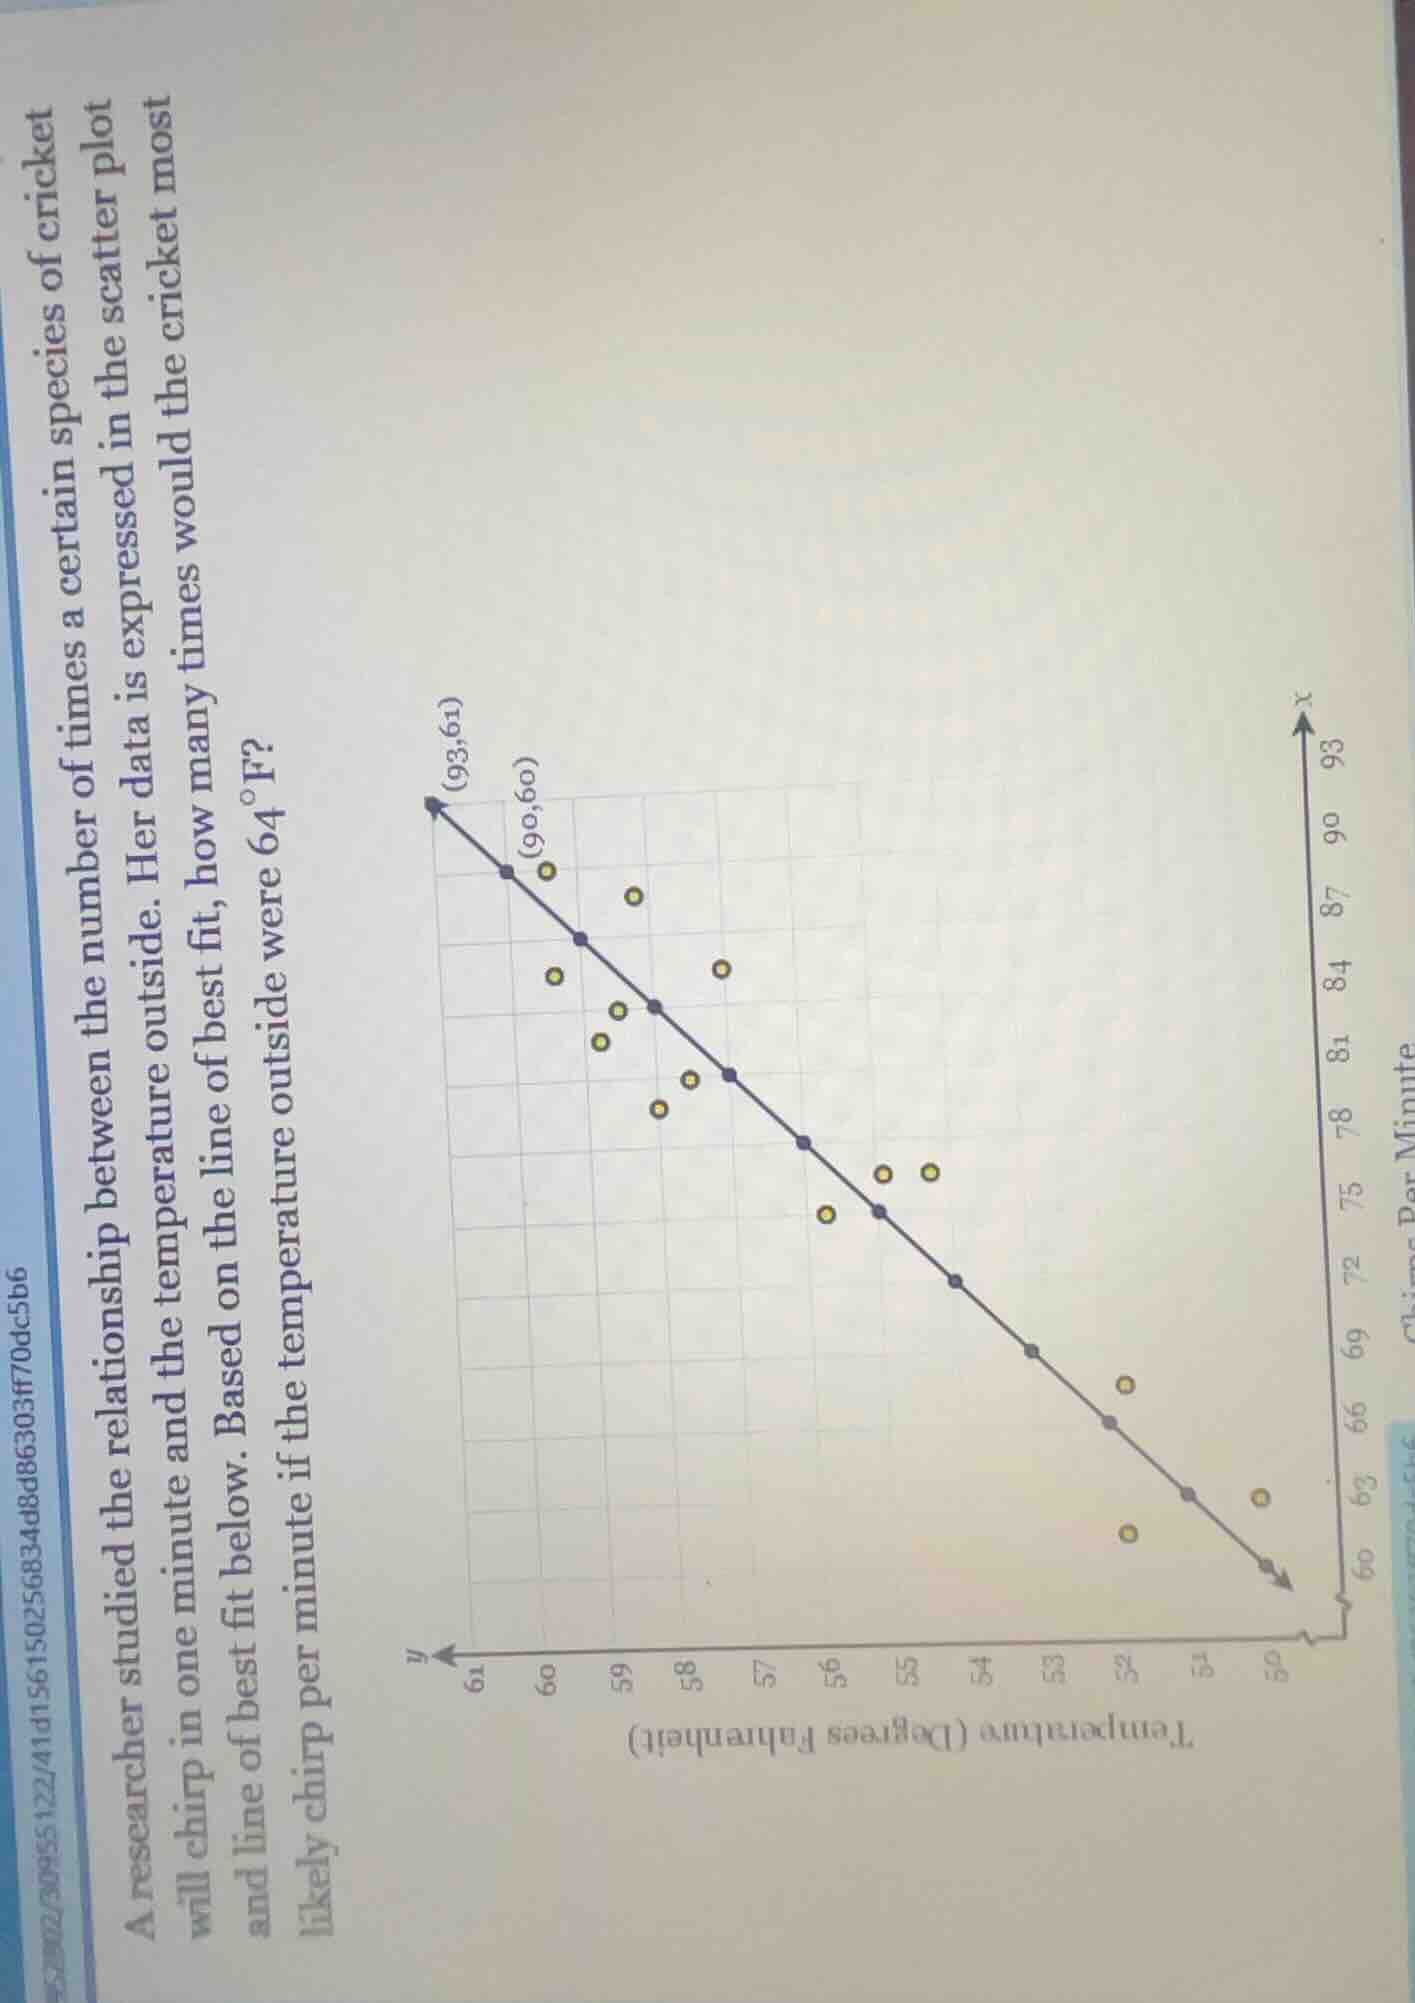
a researcher studied the relationship between the number of times a certain species of cricket will chirp in one minute and the temperature outside. her data is expressed in the scatter plot and line of best fit below. based on the line of best fit, how many times would the cricket most likely chirp per minute if the temperature outside were 64°f?
Step1: Identify line points
We use two clear points on the line of best fit: $(x_1,y_1)=(93,61)$ and $(x_2,y_2)=(90,60)$.
Step2: Calculate slope
Compute the slope $m$ of the line.
$m=\frac{y_2-y_1}{x_2-x_1}=\frac{60-61}{90-93}=\frac{-1}{-3}=\frac{1}{3}$
Step3: Find line equation
Use point-slope form $y-y_1=m(x-x_1)$ with $(93,61)$.
$y-61=\frac{1}{3}(x-93)$
Simplify to slope-intercept form:
$y=\frac{1}{3}x - 31 + 61$
$y=\frac{1}{3}x + 30$
Step4: Substitute temperature $y=64$
We need to find $x$ (chirps per minute) when $y=64$ (temperature).
$64=\frac{1}{3}x + 30$
Step5: Solve for $x$
Subtract 30 from both sides:
$64-30=\frac{1}{3}x$
$34=\frac{1}{3}x$
Multiply both sides by 3:
$x=34\times3=102$

Snap & solve any problem in the app
Get step-by-step solutions on Sovi AI
Photo-based solutions with guided steps
Explore more problems and detailed explanations
102