QUESTION IMAGE
Question
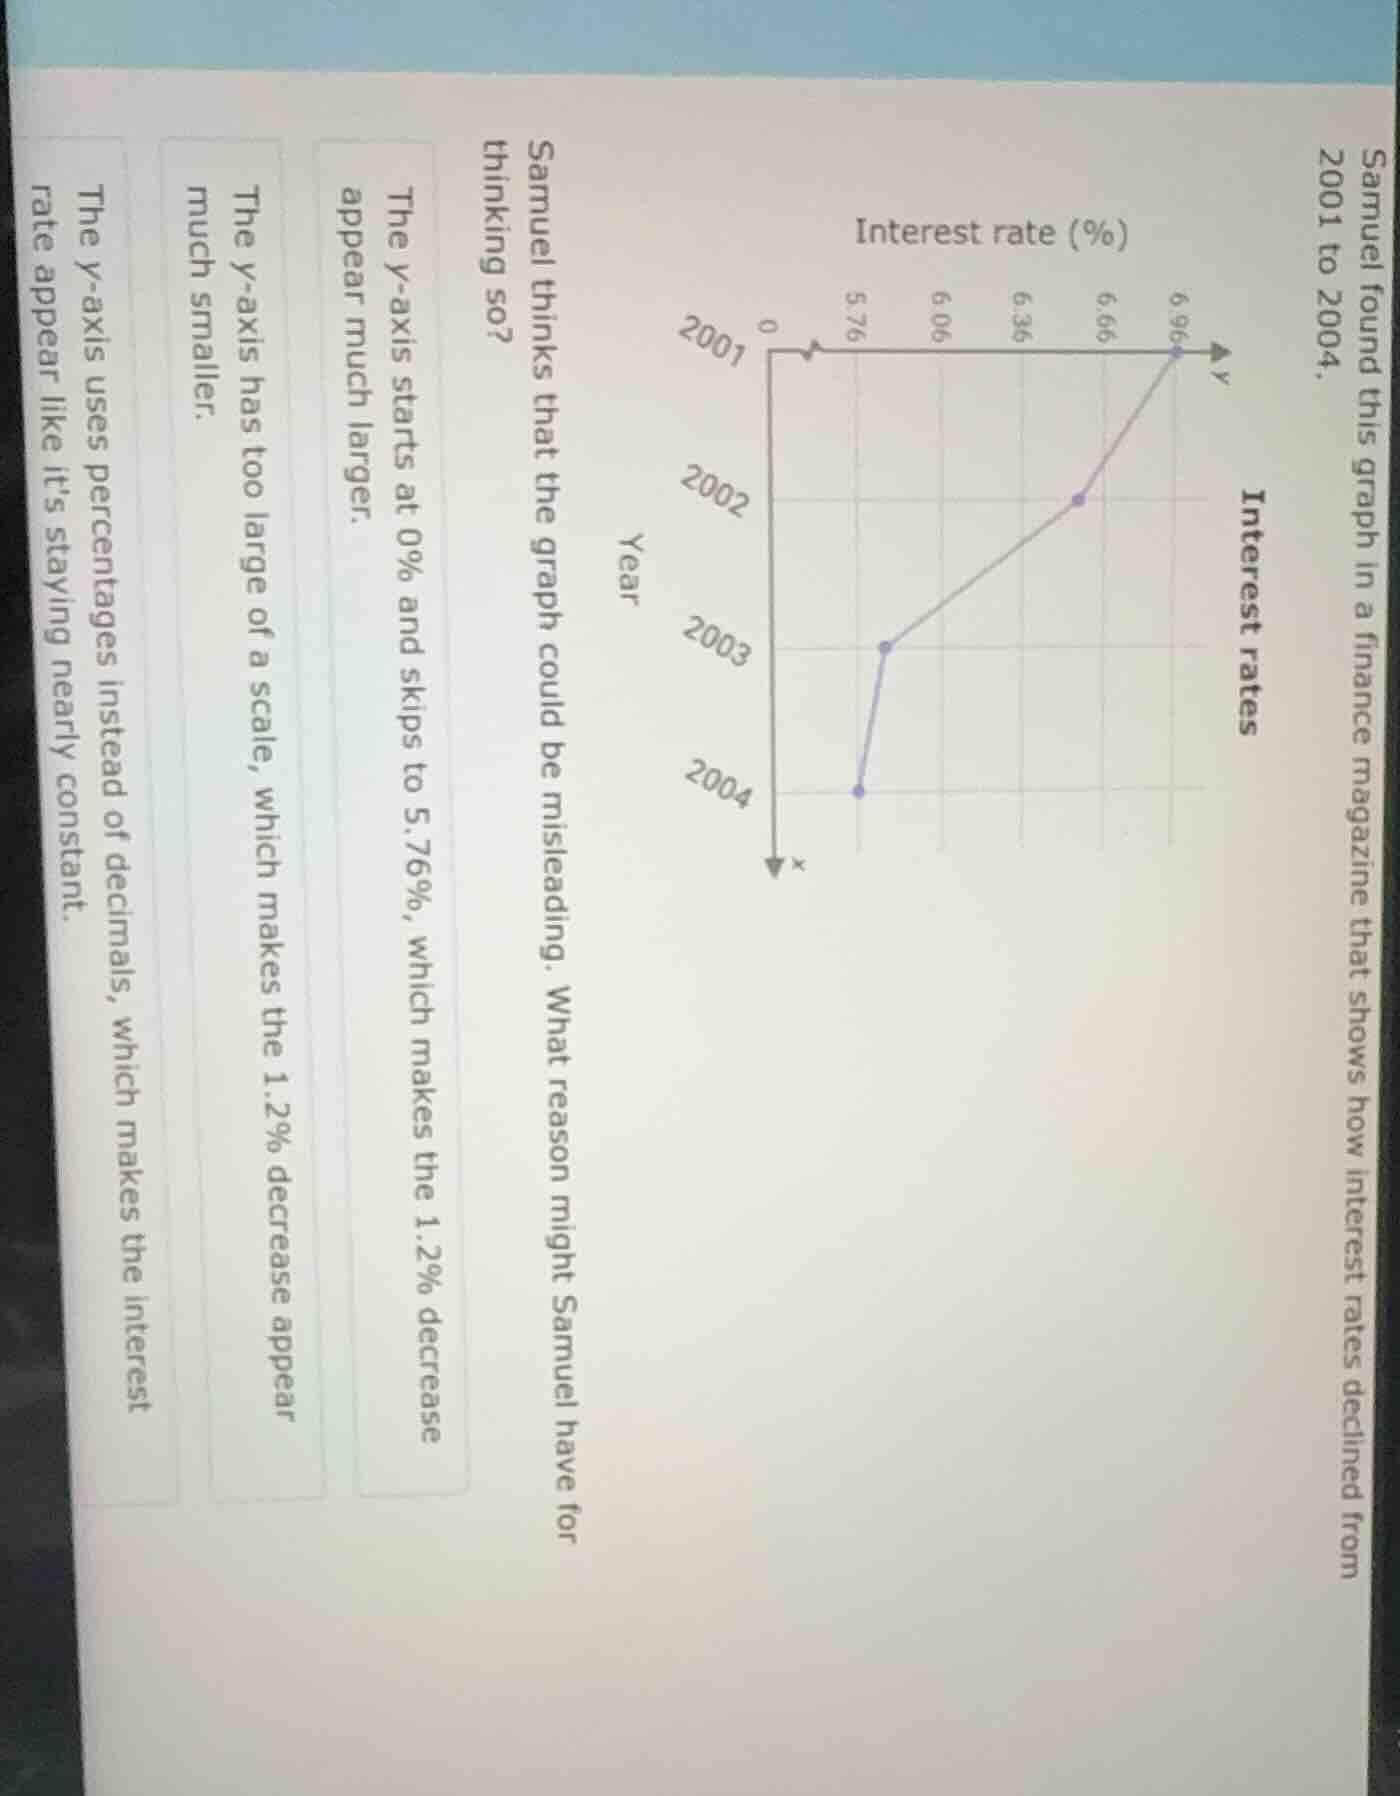
samuel found this graph in a finance magazine that shows how interest rates declined from 2001 to 2004.
samuel thinks that the graph could be misleading. what reason might samuel have for thinking so?
the y - axis starts at 0% and skips to 5.76%, which makes the 1.2% decrease appear much larger.
the y - axis has too large of a scale, which makes the 1.2% decrease appear much smaller.
the y - axis uses percentages instead of decimals, which makes the interest rate appear like it’s staying nearly constant.
To determine why the graph is misleading, we analyze the y - axis (interest rate) scale. The y - axis starts at 0% and then skips to 5.76%. When a graph's axis starts at a non - zero value (after an initial 0 that is quickly skipped), it can distort the perception of changes. A 1.2% decrease in interest rate will seem much larger because the vertical scale (which is used to represent the change) is compressed in a way that exaggerates the visual impact of the change. The other options are incorrect: the y - axis scale being large would not make a decrease appear smaller (it's about the starting point and the skip), and using percentages doesn't make the rate appear constant (the graph shows a decline, but the scale distortion is the issue here).

Snap & solve any problem in the app
Get step-by-step solutions on Sovi AI
Photo-based solutions with guided steps
Explore more problems and detailed explanations
The y - axis starts at 0% and skips to 5.76%, which makes the 1.2% decrease appear much larger.