QUESTION IMAGE
Question
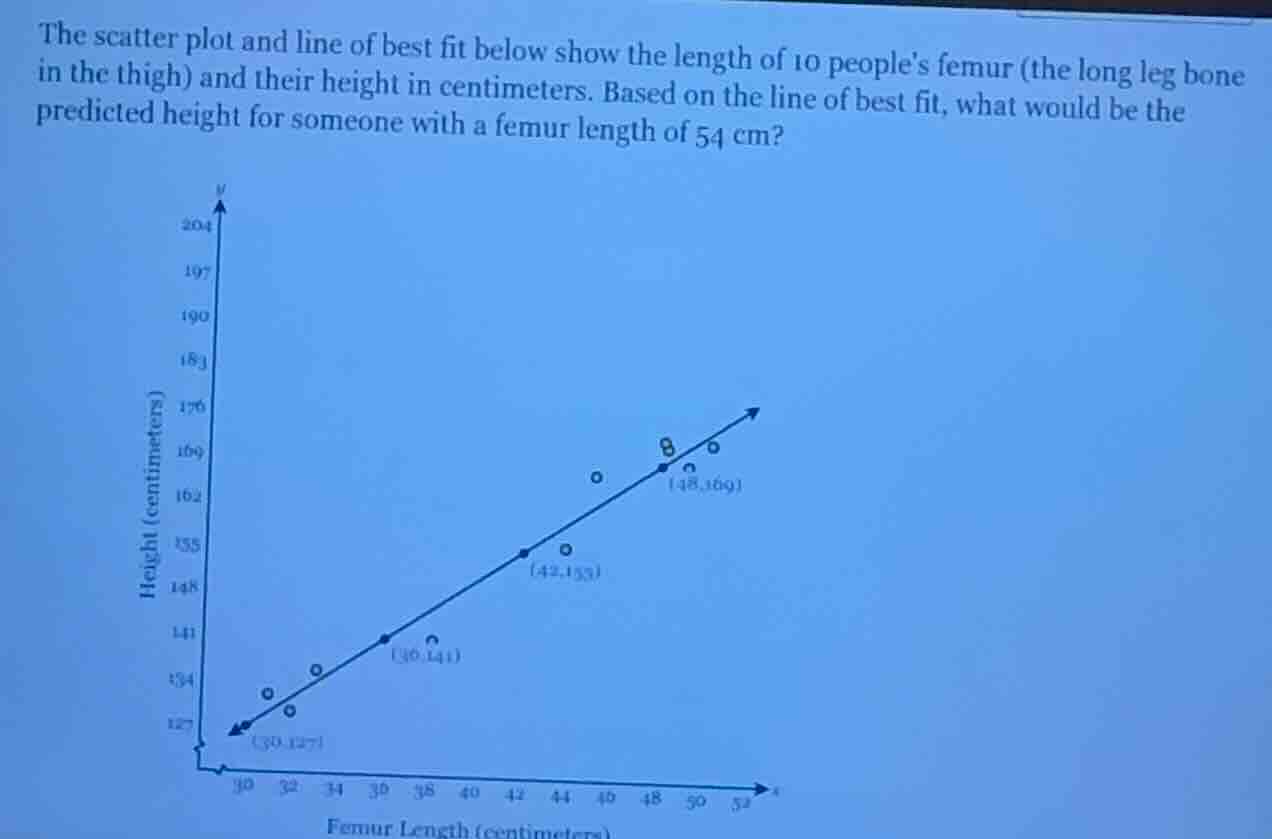
the scatter plot and line of best fit below show the length of 10 peoples femur (the long leg bone in the thigh) and their height in centimeters. based on the line of best fit, what would be the predicted height for someone with a femur length of 54 cm?
Step1: Find the slope of the line
We use two points on the line of best fit, say \((30, 127)\) and \((36, 141)\). The slope \(m\) is calculated as \(m=\frac{y_2 - y_1}{x_2 - x_1}=\frac{141 - 127}{36 - 30}=\frac{14}{6}=\frac{7}{3}\).
Step2: Find the equation of the line
Using the point - slope form \(y - y_1=m(x - x_1)\) with the point \((30, 127)\) and \(m = \frac{7}{3}\).
\(y-127=\frac{7}{3}(x - 30)\)
\(y-127=\frac{7}{3}x-70\)
\(y=\frac{7}{3}x + 57\)
Step3: Predict the height for \(x = 54\)
Substitute \(x = 54\) into the equation \(y=\frac{7}{3}x+57\).
\(y=\frac{7}{3}\times54 + 57\)
\(y = 7\times18+57\)
\(y=126 + 57\)
\(y = 183\)

Snap & solve any problem in the app
Get step-by-step solutions on Sovi AI
Photo-based solutions with guided steps
Explore more problems and detailed explanations
The predicted height for someone with a femur length of 54 cm is 183 centimeters.