QUESTION IMAGE
Question
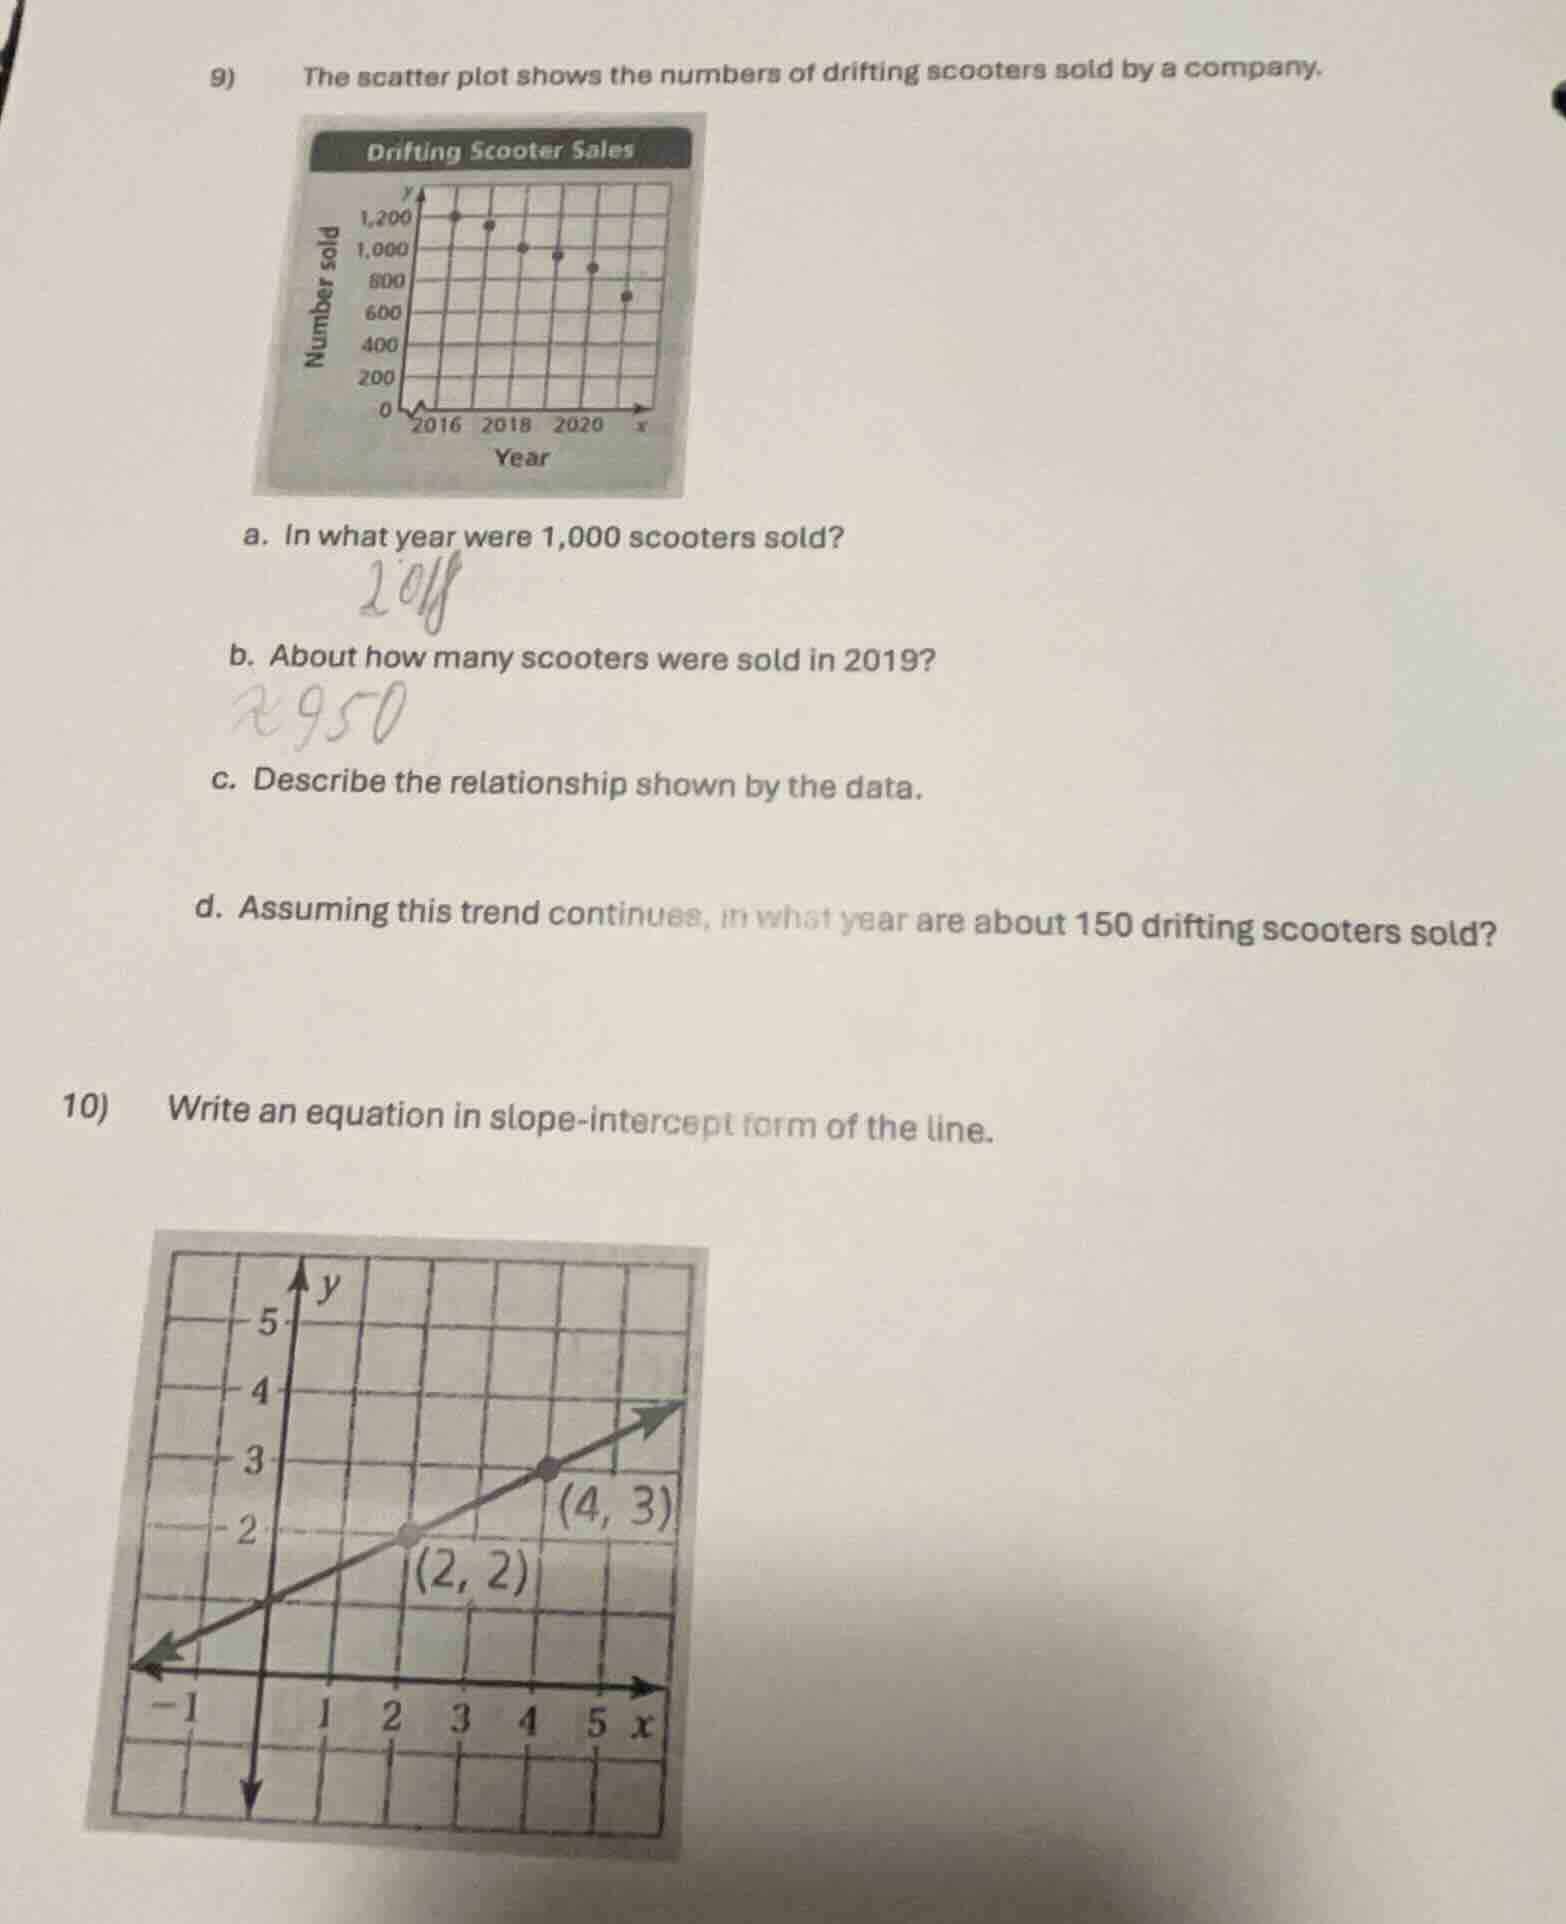
- the scatter plot shows the numbers of drifting scooters sold by a company.
drifting scooter sales
number sold
year
a. in what year were 1,000 scooters sold?
b. about how many scooters were sold in 2019?
c. describe the relationship shown by the data.
d. assuming this trend continues, in what year are about 150 drifting scooters sold?
- write an equation in slope - intercept form of the line.
(2, 2)
(4, 3)
Question 9
Part a
Step1: Analyze the scatter plot
Look at the scatter plot where the y - axis is the number of scooters sold and the x - axis is the year. Find the point where the number of scooters sold (y - value) is 1000 and then determine the corresponding year (x - value). From the plot, when the number of scooters sold is 1000, the year is 2018.
Step1: Locate the year 2019 on the x - axis
Find the position corresponding to the year 2019 on the scatter plot's x - axis. Then, estimate the y - value (number of scooters sold) at that x - value. From the trend of the scatter plot, the number of scooters sold in 2019 is approximately 900 (or a value close to 900, the initial estimate of 950 is also reasonable as it is an approximation).
Step1: Observe the direction of the points
As the year (x - value) increases, the number of scooters sold (y - value) decreases. So, there is a negative correlation between the year and the number of drifting scooters sold. In other words, as the years pass (from 2016 onwards), the number of scooters sold is decreasing.

Snap & solve any problem in the app
Get step-by-step solutions on Sovi AI
Photo-based solutions with guided steps
Explore more problems and detailed explanations
2018