QUESTION IMAGE
Question
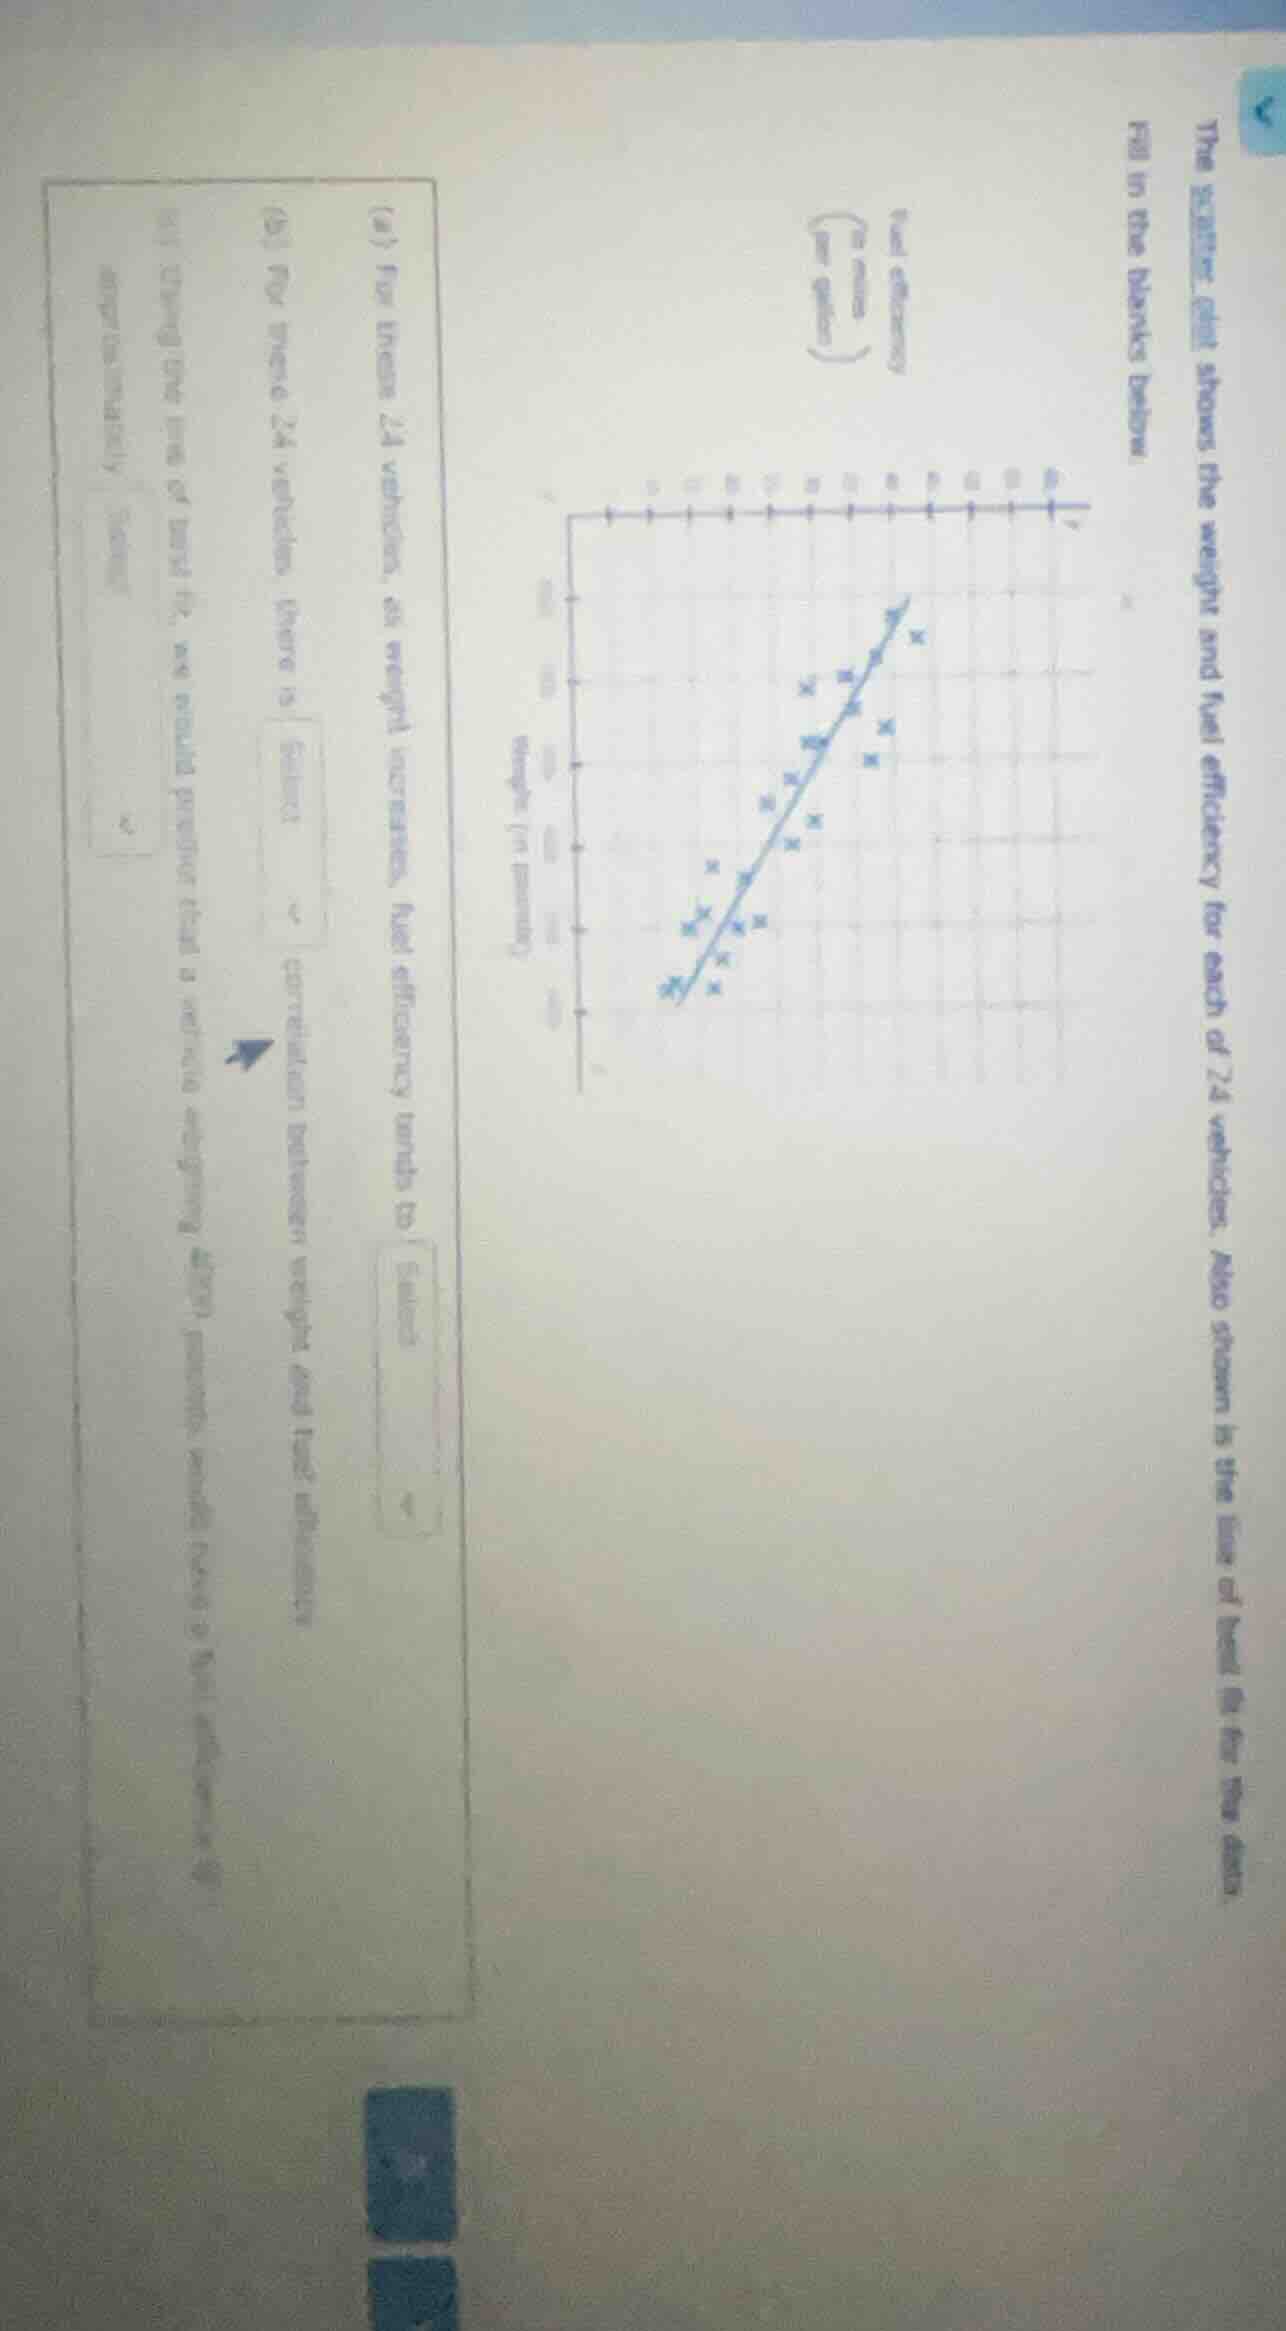
the scatter plot shows the weight and fuel efficiency for each of 24 vehicles. also shown is the line of best fit for the data.fill in the blanks below:(a) for these 24 vehicles, as weight increases, fuel efficiency tends to select(b) for these 24 vehicles, there is select correlation between weight and fuel efficiency(c) using the line of best fit, we would predict that a vehicle weighing 4000 pounds would have a fuel efficiency of approximately select
Step1: Analyze scatter plot trend
Observe that as weight (x-axis) increases, fuel efficiency (y-axis) moves downward.
Step2: Identify correlation type
The downward trend means variables move in opposite directions, so it is a negative correlation.
Step3: Predict value from line of best fit
Locate 4000 pounds on x-axis, move up to the line of best fit, then left to y-axis to read the value, which is approximately 25 miles per gallon.

Snap & solve any problem in the app
Get step-by-step solutions on Sovi AI
Photo-based solutions with guided steps
Explore more problems and detailed explanations
(a) decrease
(b) negative
(c) 25