QUESTION IMAGE
Question
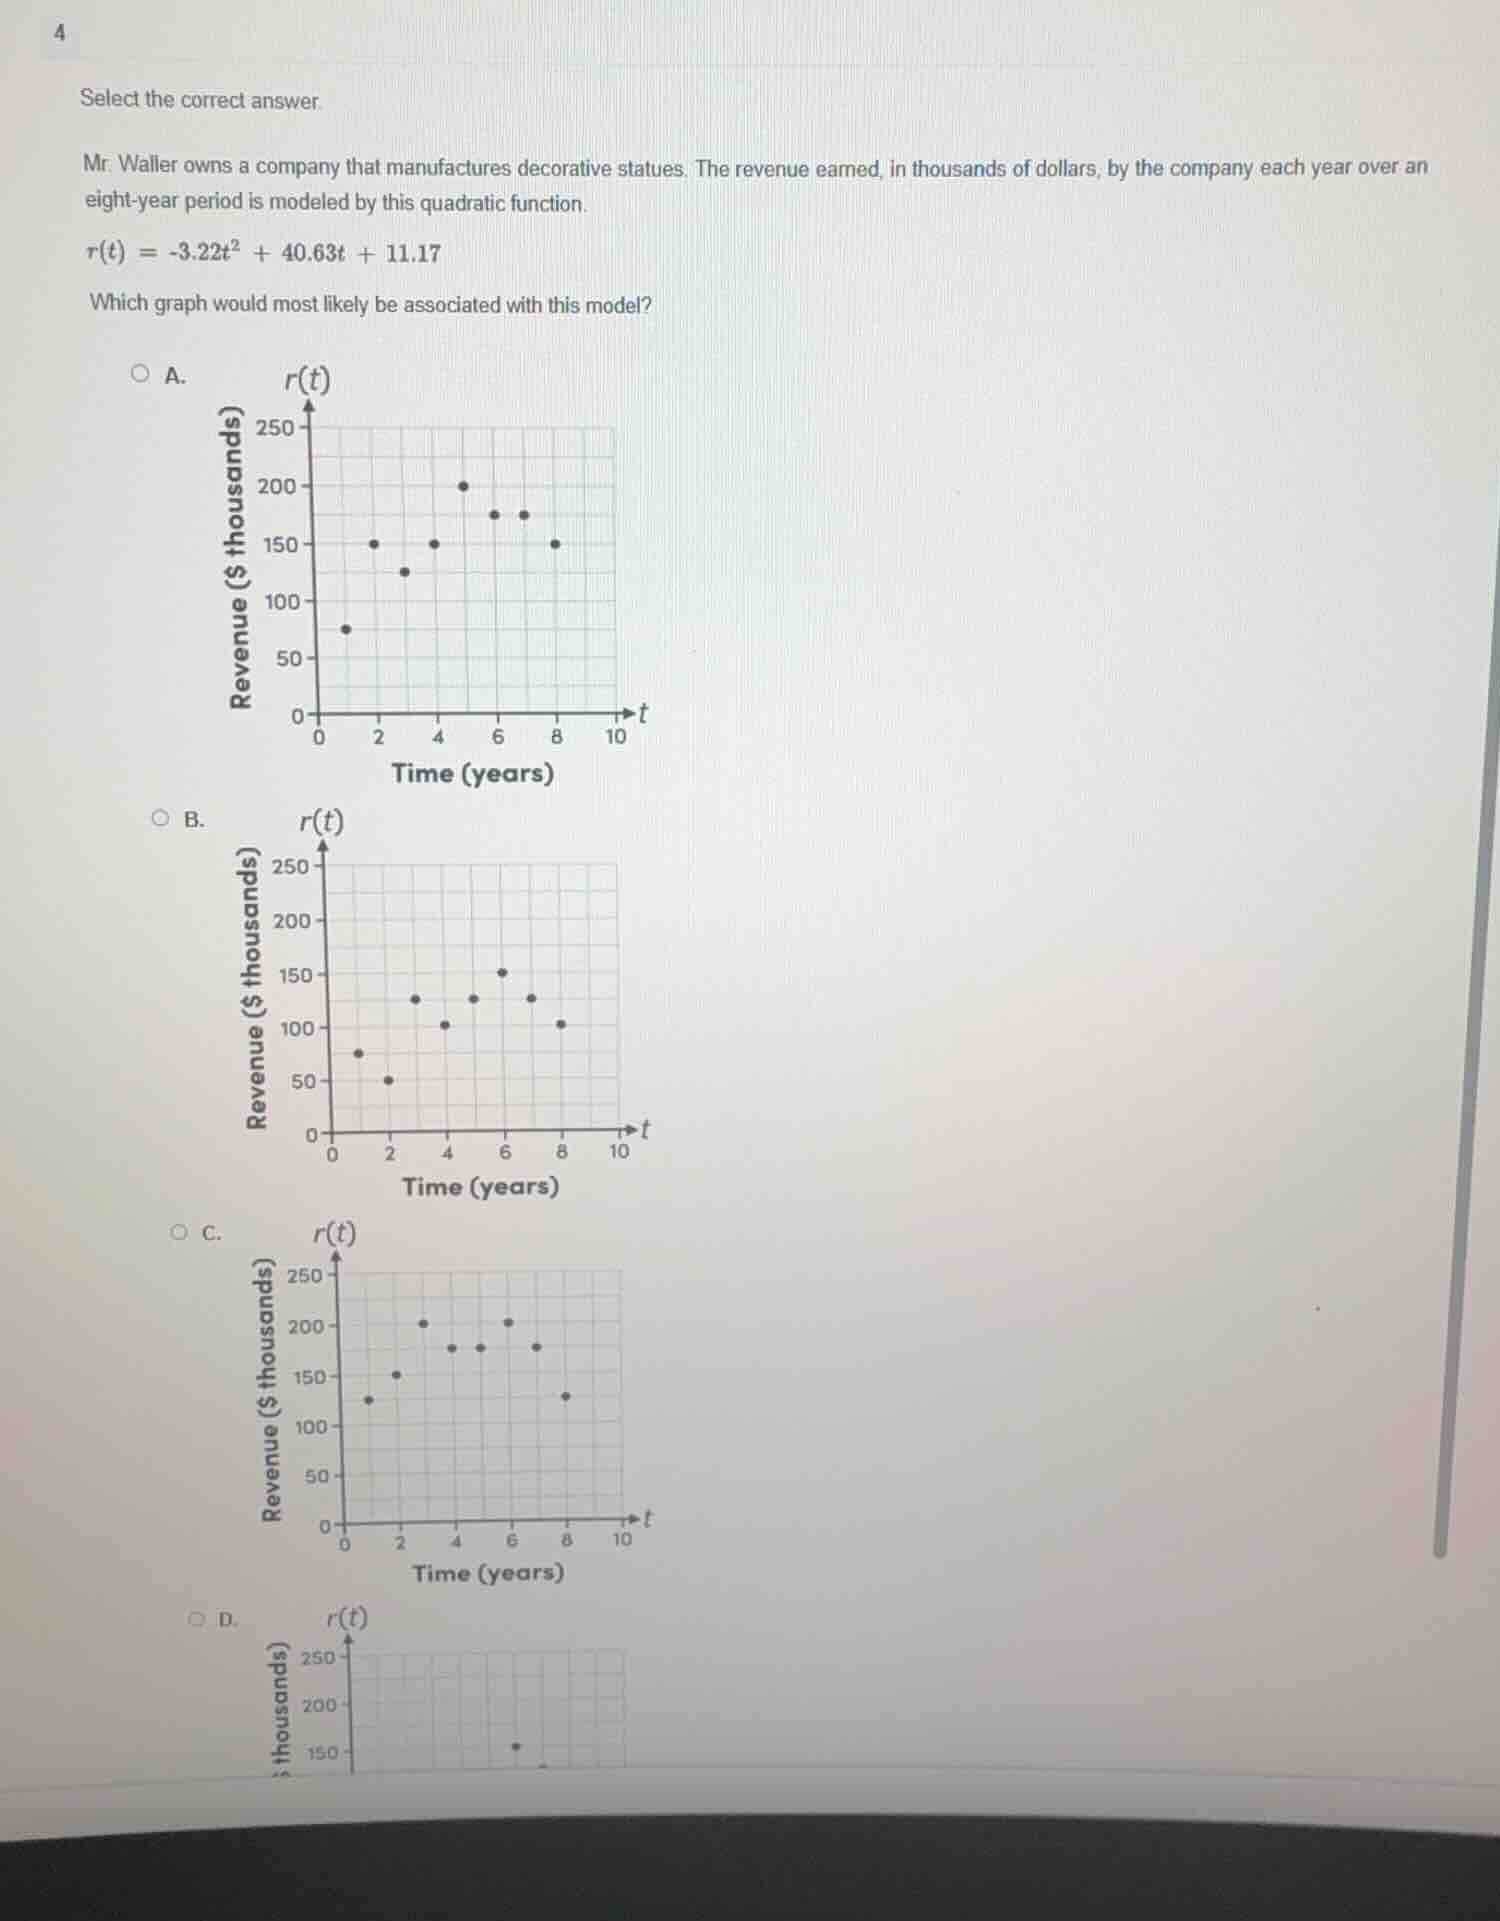
select the correct answer.
mr. waller owns a company that manufactures decorative statues. the revenue earned, in thousands of dollars, by the company each year over an eight-year period is modeled by this quadratic function.
r(t) = -3.22t² + 40.63t + 11.17
which graph would most likely be associated with this model?
a. graph with revenue on y-axis (thousands) and time (years) on x-axis, data points: around (0,75), (2,150), (3,125), (4,150), (5,200), (6,175), (7,175), (8,150)
b. graph with revenue on y-axis (thousands) and time (years) on x-axis, data points: around (0,75), (2,50), (3,100), (4,125), (5,150), (6,125), (7,100)
c. graph with revenue on y-axis (thousands) and time (years) on x-axis, data points: around (0,125), (2,150), (3,200), (4,175), (5,175), (6,200), (7,175), (8,125)
d. partial graph with revenue on y-axis (thousands) and time (years) on x-axis, data point around (6,150) and (8, below 150)
Step1: Identify parabola direction
Quadratic: $r(t)=-3.22t^2+40.63t+11.17$, $a=-3.22<0$ → opens downward.
Step2: Find vertex time
Vertex $t=-\frac{b}{2a}=-\frac{40.63}{2(-3.22)}\approx6.3$ years.
Step3: Calculate key values
$t=0$: $r(0)=11.17$; $t=6$: $r(6)\approx-3.22(36)+40.63(6)+11.17\approx190$; $t=8$: $r(8)\approx-3.22(64)+40.63(8)+11.17\approx150$.
Values match Graph A: starts low, peaks ~t=6, then decreases.

Snap & solve any problem in the app
Get step-by-step solutions on Sovi AI
Photo-based solutions with guided steps
Explore more problems and detailed explanations
A. [Graph A with points showing initial increase then slight decrease]